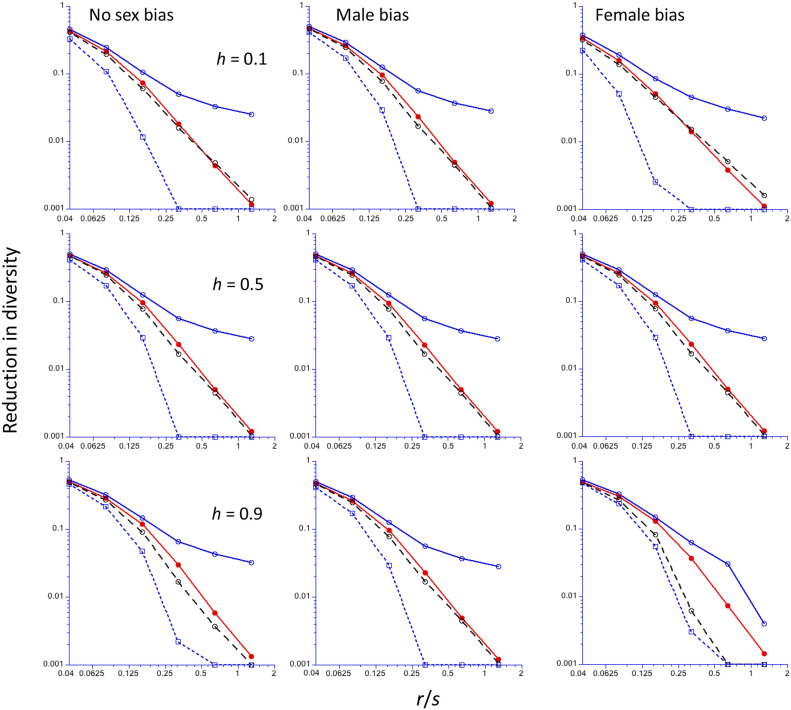
Figure 4.
The reduction in diversity (relative to the neutral value) at the end of a sweep for an x-linked locus (y-axis, log10 scale), as a function of the ratio of the frequency of recombination (r) to the selection coefficient for homozygotes (s) (x-axis, log2 scale). The Drosophila recombination model is assumed; Ne for the X chromosome is three-quarters of that for the autosomes. The results for mutations with no sex limitation are shown in the left-hand panels; those for male-limited and female-limited mutations are shown in the middle and right-hand panels, respectively. A population size of 5000 is assumed, with a scaled selection coefficient for an autosomal mutation in a randomly mating population (γ = 2Nes) of 250 for the cases with no sex-limitation. For the sex-limited cases, γ = 500 to ensure comparability to sex-limited autosomal mutations. Results for three different values of the dominance coefficient (h) are shown, with h increasing from the top to bottom panels. The filled red circles are the mean values from computer simulations, using Tajima’s algorithm; the open blue circles and black circles are the C1 and C2 predictions, respectively; the open blue squares are the NC predictions. Values of the reduction in diversity <0.001 have been reset to 0.001.

