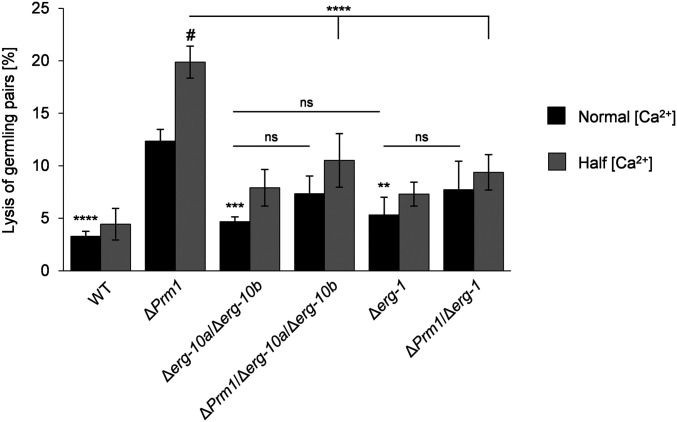
Figure 5.
The various plasma membrane fusion mutants differ in the frequency of fusion-induced cell lysis. Quantitative analysis of cell lysis in germling pairs of WT (FGSC 2489) and mutants lacking erg genes and/or Prm1 on MM, with normal and reduced levels of Ca2+. Values represent the mean ± SD from three independent populations of 100–125 germling pairs per replicate, strain, and growth condition. Statistical analysis with ANOVA and Tukey’s post hoc test: **P < 0.01, ***P < 0.001, ****P < 0.0001 for comparisons with ΔPrm1 at normal Ca2+ concentration; horizontal lines denote additional comparisons between strains (***P < 0.001); # denotes a significant difference (P < 0.001) for comparisons of ΔPrm1 between normal and half Ca2+ concentration, with no significant differences for any of the other strains between these two growth conditions. FGSC, Fungal Genetics Stock Center; MM, minimal medium; ns, not significant; WT, wild-type.

