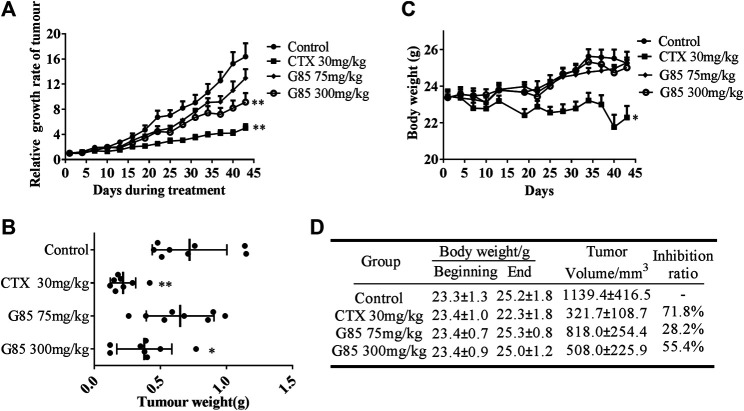
FIGURE 7.
The antitumor effect of G85 in the SK-Hep1 cell xenograft model in vivo. (A) The tumor growth curve, drawn according to the average percentage change of the tumor volume (B) The tumor weight of SK-Hep1 xenograft at the end of treatment in each group (n = 8). (C) The curve of mouse body weight measured every 3 days (D) Data of body weight before and after course of treatment and tumor inhibition at the end of treatment. Data were shown as mean ± SD.*p < 0.05, **p < 0.01, vs control.

