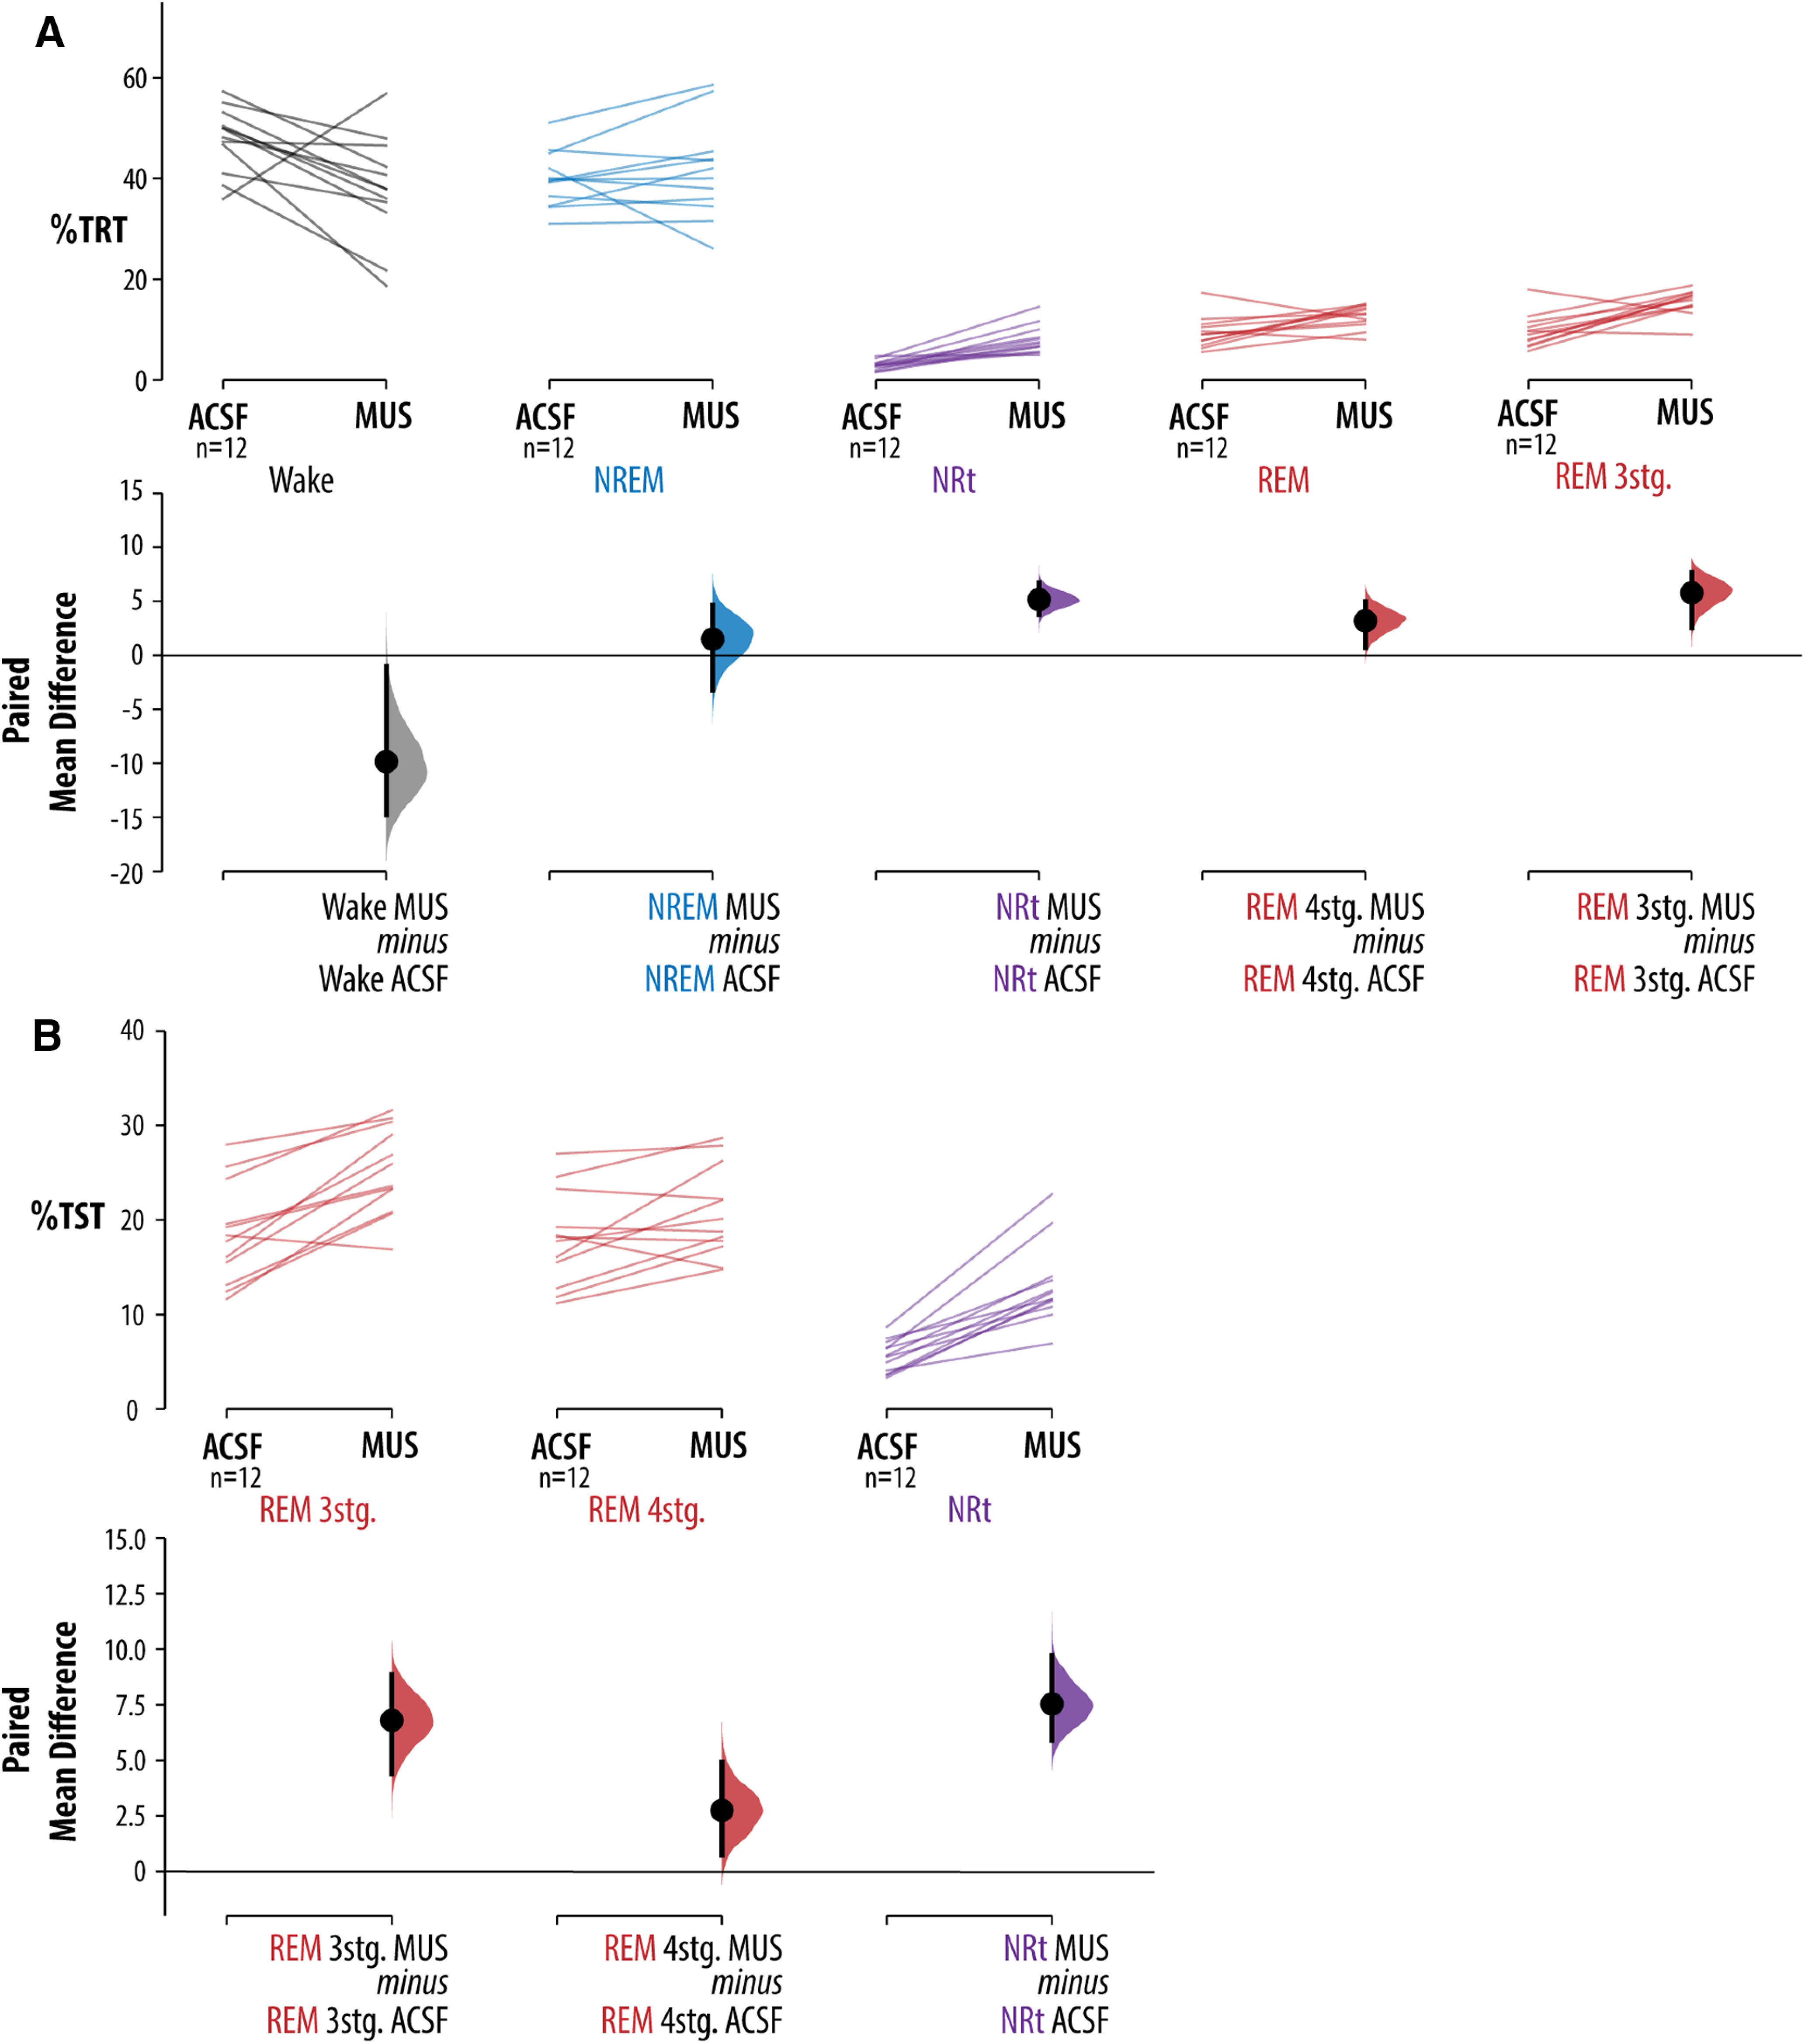
Figure 3.

Effects of vlPAG/DpMe inhibition on sleep macroarchitecture and bistability. A, Effects of vlPAG/DpMe inhibition on the levels of sleep-wake states as a proportion of the TRT. Levels of REM sleep are given for both 3-stage scoring and 4-stage NRt scoring. B, Effects of vlPAG/DpMe inhibition on the levels of REM sleep and NRt states as a proportion of the TST. Levels of REM sleep are given for both 3-stage scoring and 4-stage NRt scoring. For each comparison, the paired mean differences are shown in Cumming estimation plots. The raw data are plotted on the upper axes; each paired set of observations is connected by a line. On the lower axes, each paired mean difference is plotted as a bootstrap sampling distribution. Mean differences are depicted as dots; 95% CIs are indicated by the ends of the vertical error bars.
