Figure 1.

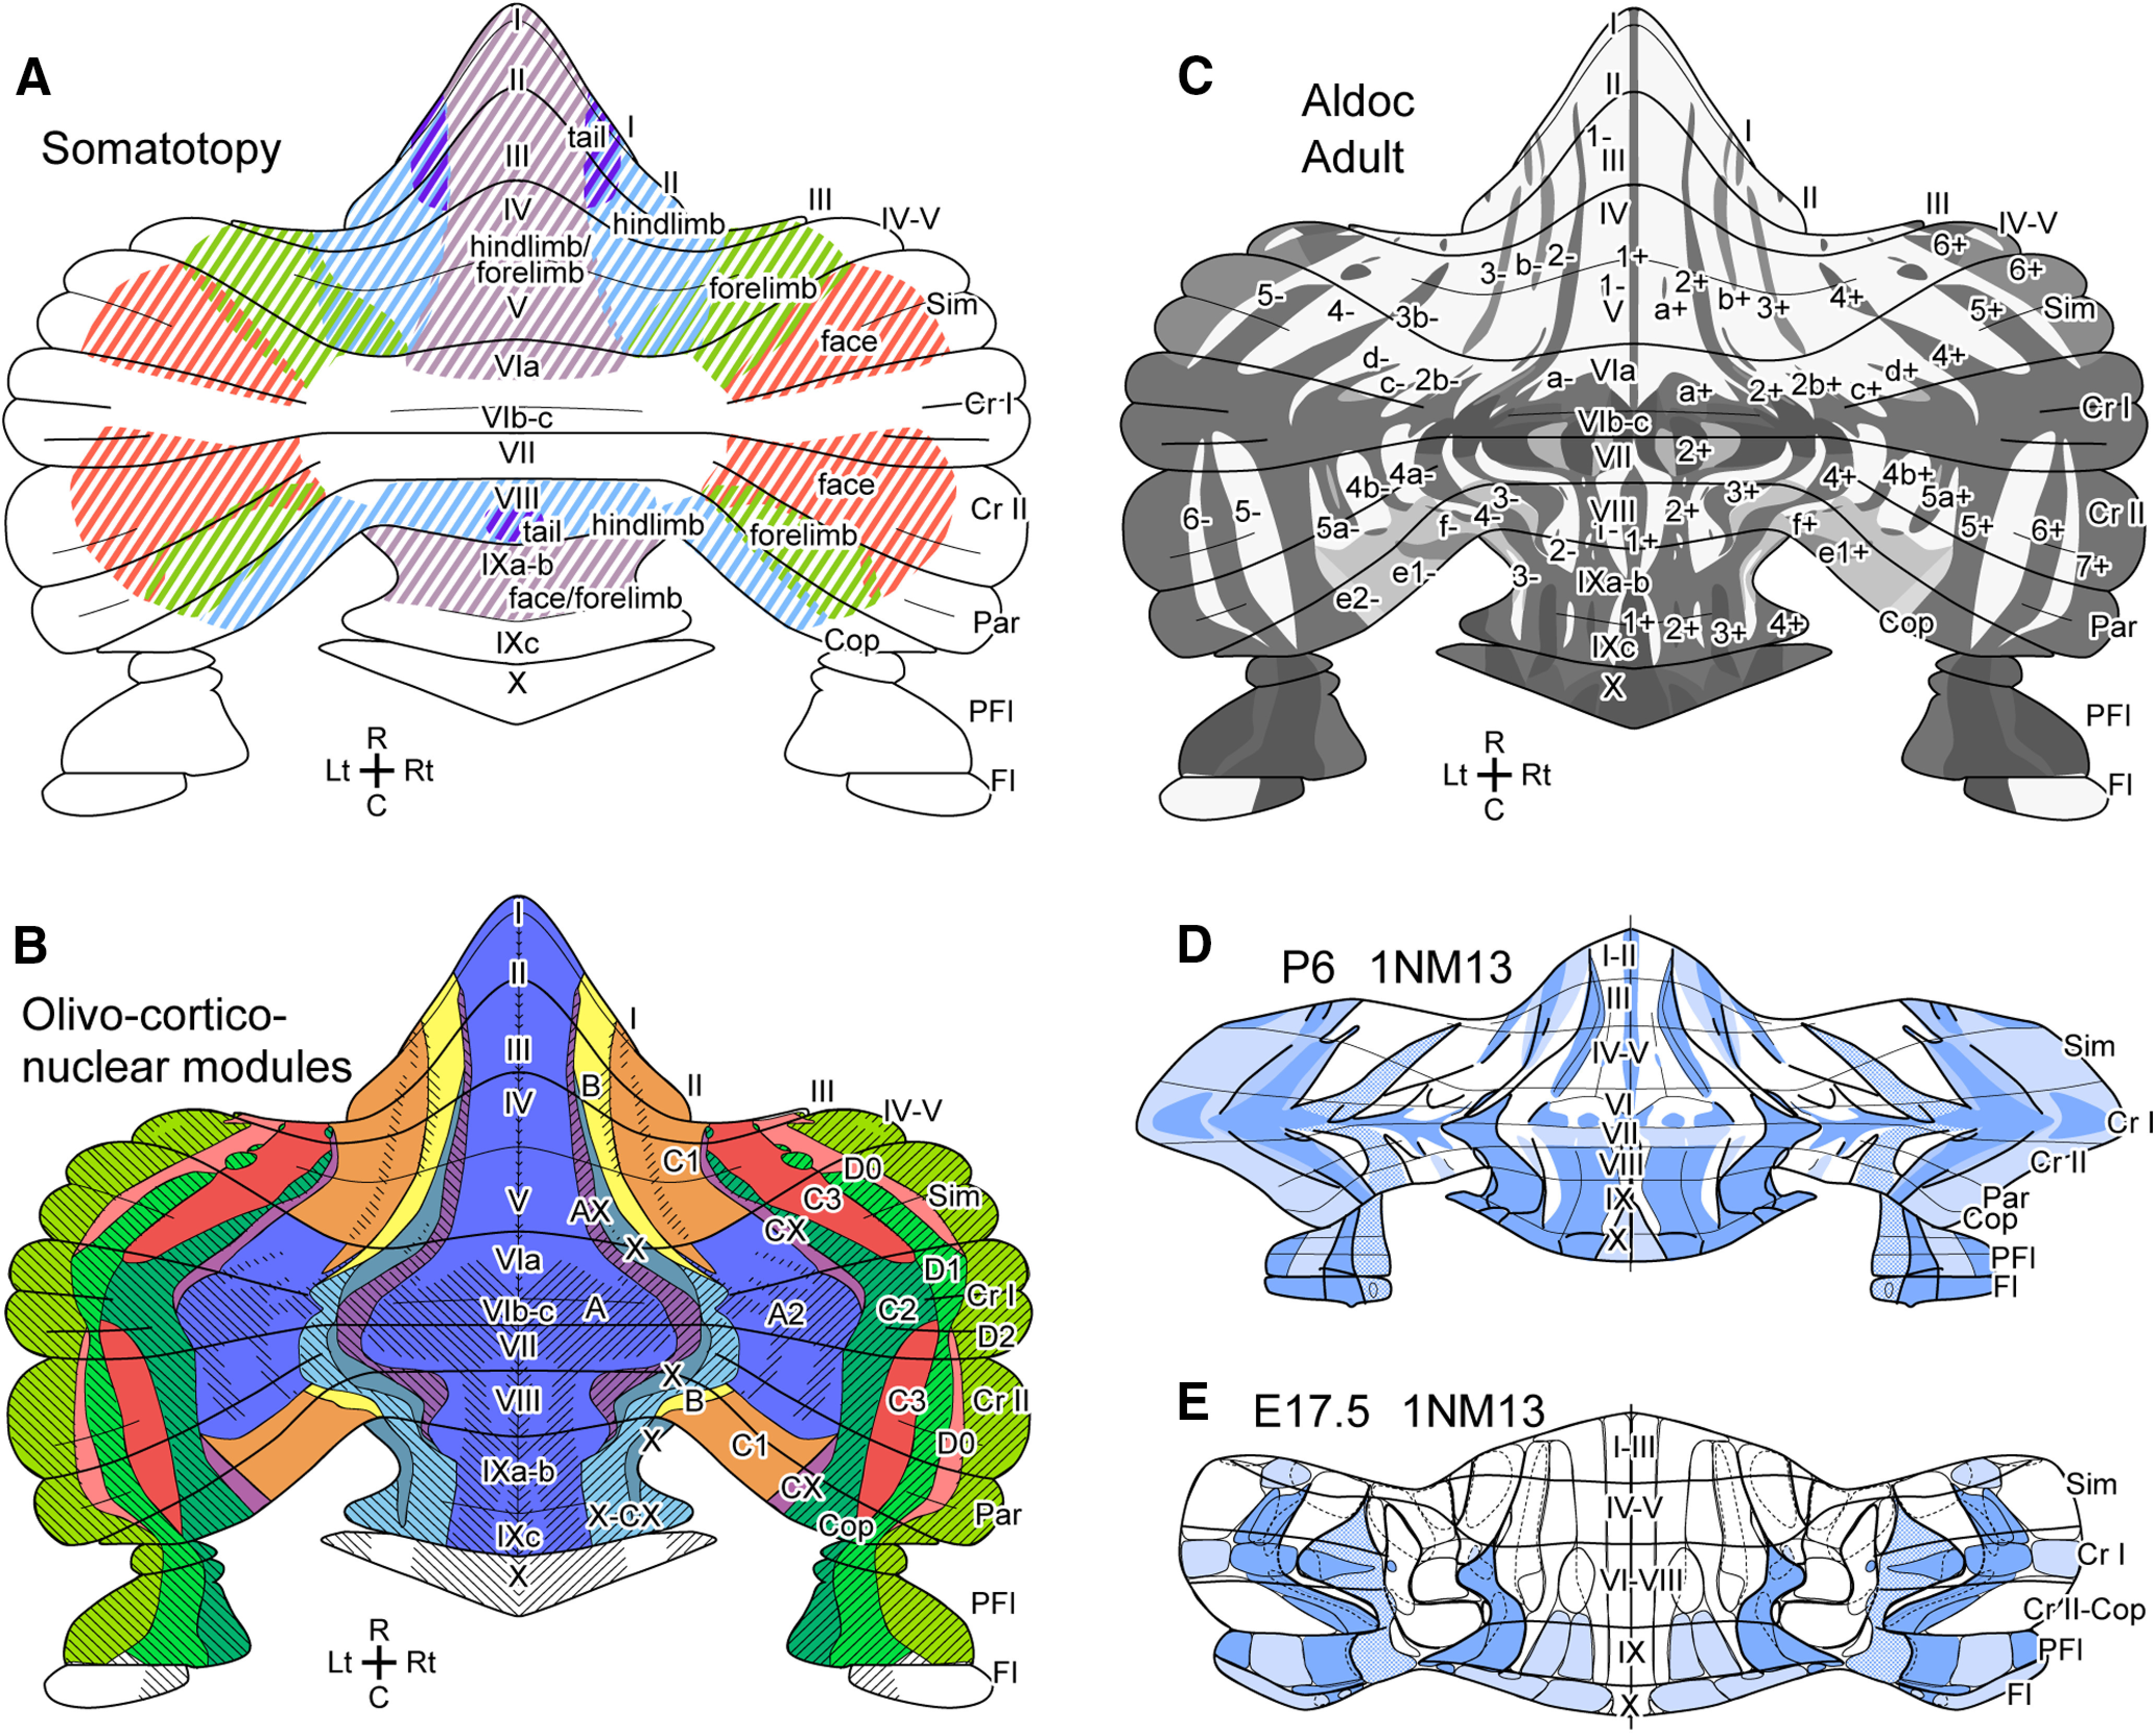
Introductory schematic drawings of the somatotopy and compartments mapped in the unfolded scheme of the mouse cerebellar cortex. A, Somatotopy mainly based on mapping of mossy fiber terminal response (Welker, 1987) and labeled spinocerebellar and cuneocerebellar projections in rodents (Quy et al., 2011; Luo et al., 2018, 2020). B, Olivocorticonuclear modules (colored areas) defined by the topographic axonal projections between subareas of the inferior olive, cerebellar nuclei and cerebellar cortex (A, AX, A2, B, CX, X, X-CX, C1, C2, C3, D0, D1 and D2 modules; Voogd and Glickstein, 1998; Sugihara and Shinoda, 2004; Ruigrok et al., 2015). Shadowed areas belong to aldolase C-positive stripes. C, Stripes defined by aldolase C expression pattern in Purkinje cells (Fujita et al., 2014; Sarpong et al., 2018). D and E, Mapping of clusters of PCs at E14.5 and immature stripes of PCs at P6 based on Fujita et al. (2012). Blue areas indicate particular clusters or immature stripes that express lacZ in 1NM13 transgenic mice, which often overlap with zebrin stripes. Abbreviations, c-l, c-m, d, dl, l, m, ml, rdl, vl, names of E14.5 clusters; C, caudal; D, dorsal; L, lateral; M, medial; R, rostral. V, ventral.
