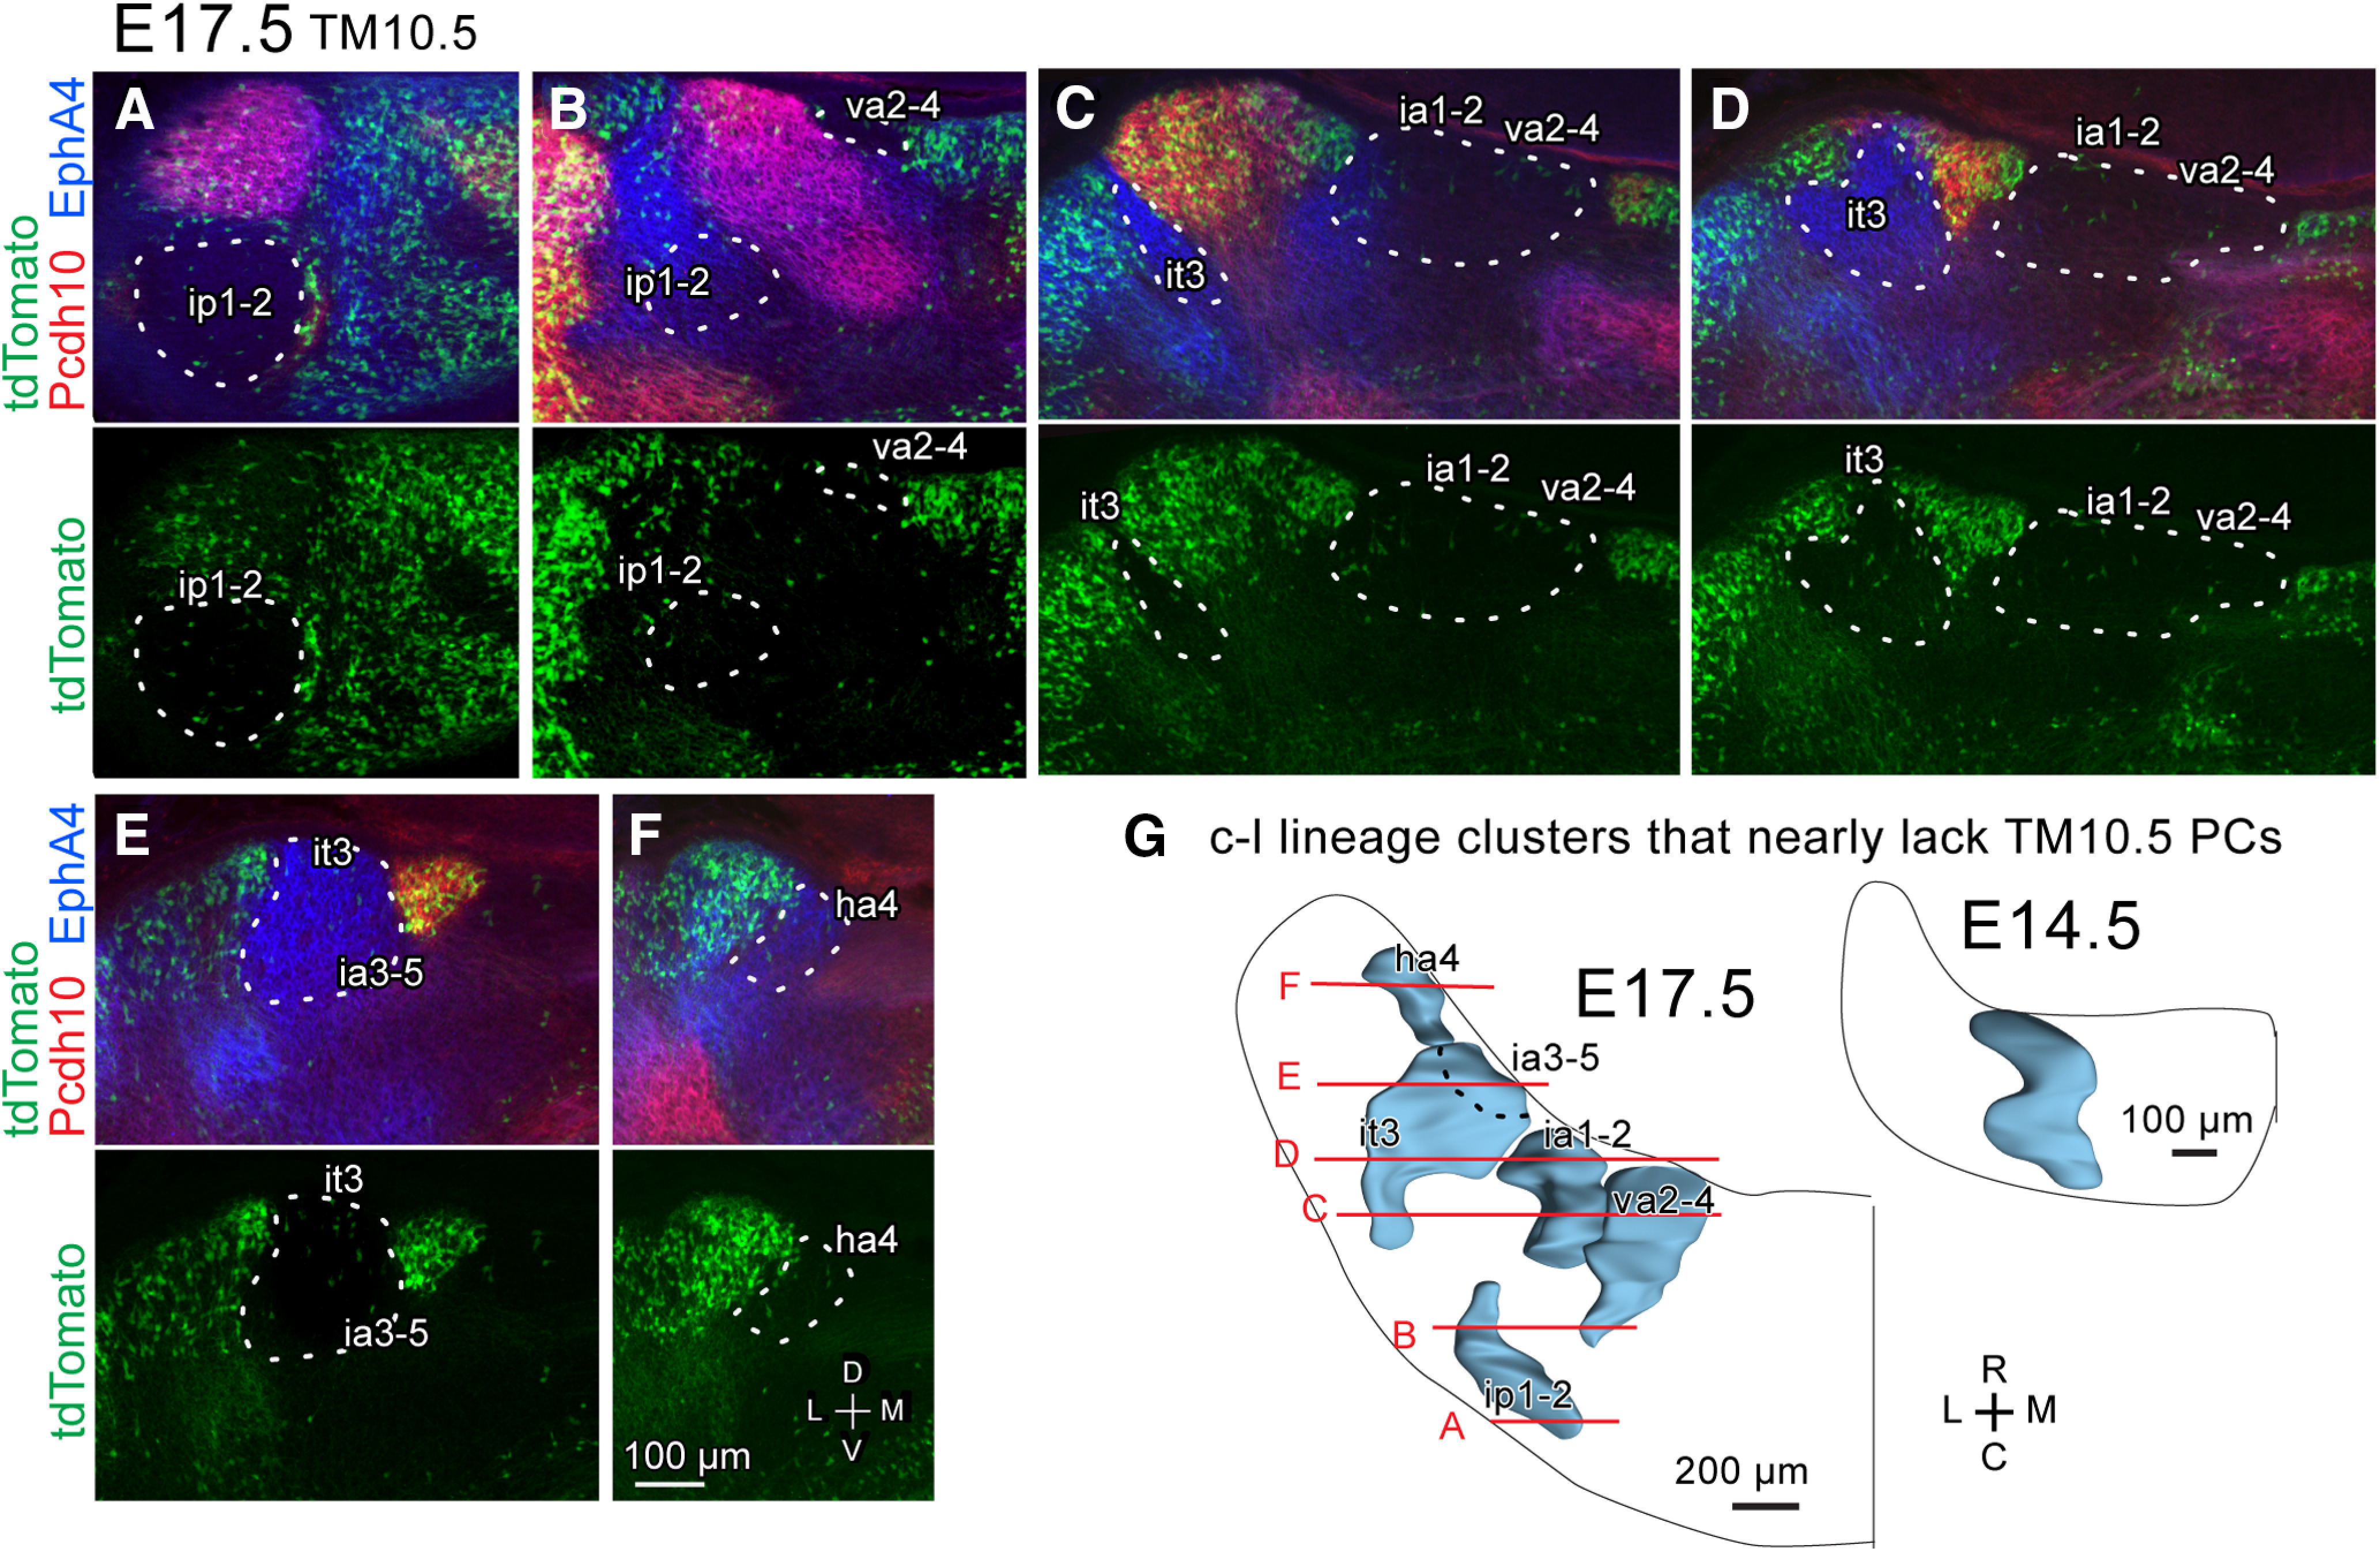
Figure 8.

Separated distribution of the E10.5-PC-sparse c-l lineage clusters in the E17.5 cerebellum. A–F, Images of a part of the coronal section at various rostrocaudal levels of the left cerebellum. The top subpanel shows the merged signal of Pcdh10 immunostaining (red), EphA4 immunostaining (blue) and tdTomato expression indicating E10.5-born PCs (green), whereas the bottom subpanel shows only tdTomato expression. White dashed lines demarcate E10.5-PC-sparse areas. Scale bar in F applies A–F. G, Dorsal view of the 3D scheme of the c-l lineage clusters in the left E17.5 cerebellum, compared with the single c-l cluster in the left E14.5 cerebellum. Black dashed line indicate the contour of the ia3-5 cluster which is located ventral to the it3 cluster. Abbreviations, ha4, ia1-2, ia3-5, it3, ip1-2, va2-4, names of E17.5 clusters; C, caudal; D, dorsal; L, lateral; M, medial; R, rostral.V, ventral.
