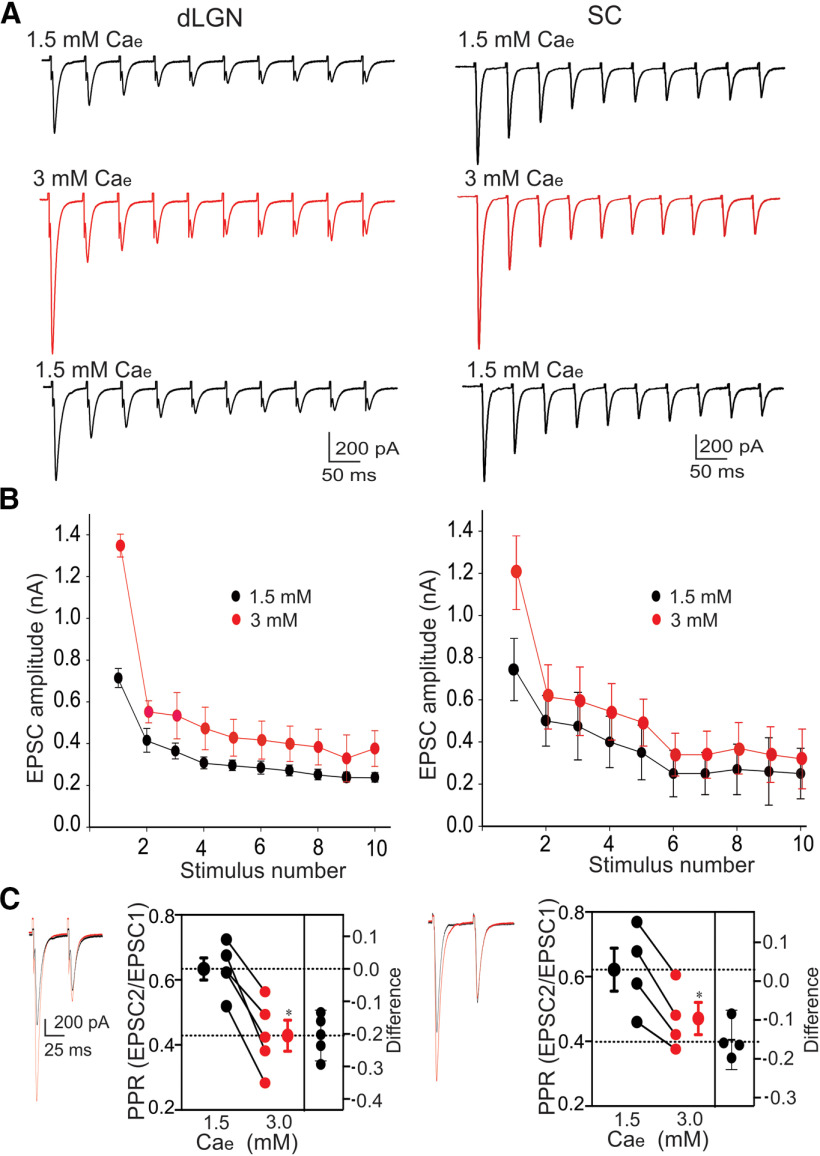
Figure 2.
The effects of Cae on dLGN and SC synaptic responses. Whole-cell voltage-clamp recordings showing the EPSCs evoked by repetitive OT stimulation. A, Examples of dLGN (left) and SC (right) EPSCs evoked by repetitive stimulation at 20 Hz during wash-in of 1.5 mm Cae, followed by 3.0 mm and then 1.5 mm Cae. B, Below each example are the summary plots for dLGN (n = 6) and SC (n = 6) neurons showing mean ± SD changes in EPSC amplitude as a function of stimulus number within the stimulus train during 1.5 Cae (black symbols) and 3.0 mm Cae (red symbols) C, Examples of dLGN (left) and SC (right) EPSCs evoked by paired OT stimulation (50-ms ISI) during wash-in of 1.5 mm Cae (black) and 3.0 mm Cae (red). Adjacent summary plots depict PPRs (left y-axis) for individual neurons (dLGN, n = 5; SC, n = 4) as well as group mean ± SEM values (large symbols). Also included (right y-axis) are paired differences for each neuron, along with error bars that reflect the 95CI. Dotted horizontal lines depict the group mean at 1.5 mm Cae (top) and the average difference between group means (effect size). For both dLGN and SC neurons, an increase in Cae led to larger initial responses and stronger paired pulse depression (dLGN *p = 0.0019; SC *p = 0.0081). All responses recorded at −70 mv.

