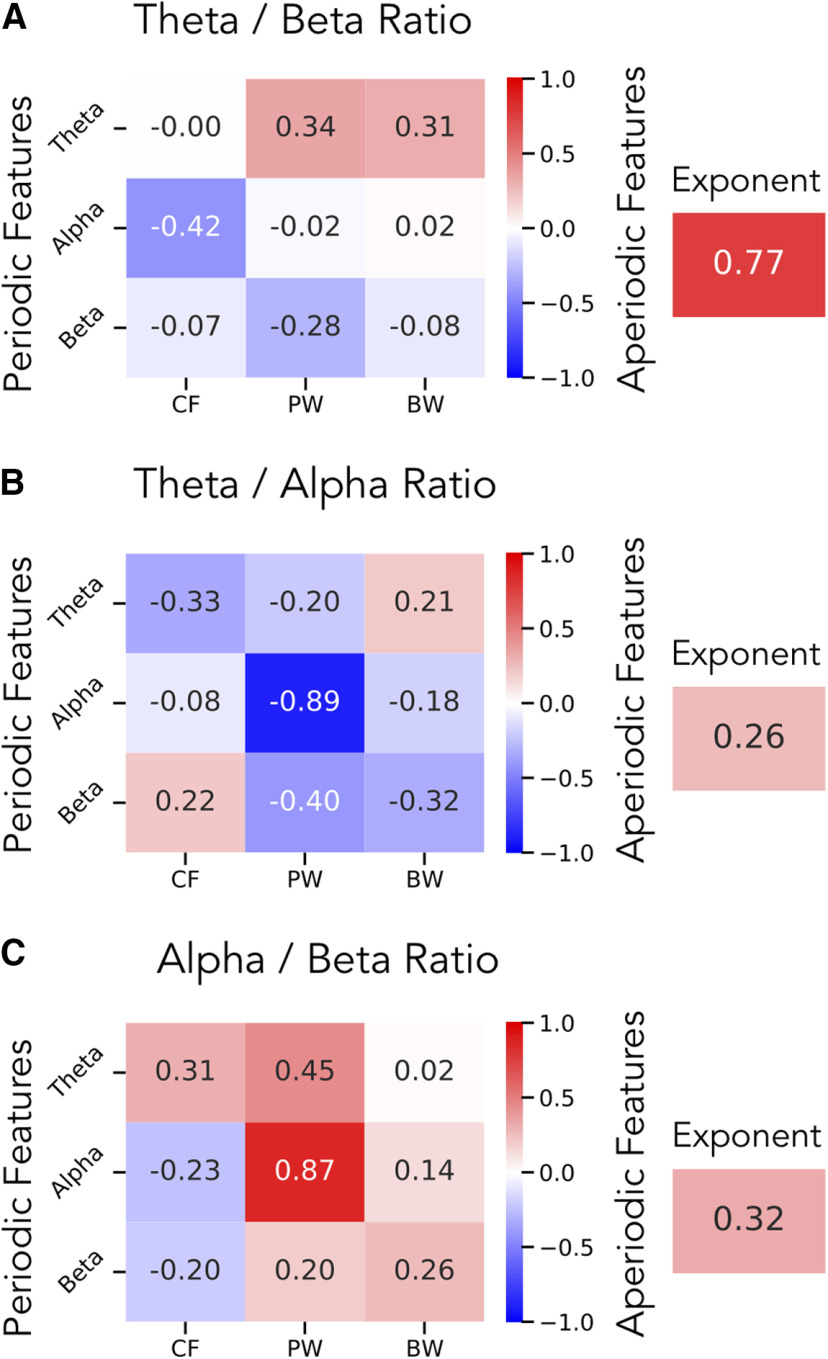
Figure 6.
Correlations between spectral parameters and band ratio measures in EEG data. In a large EEG dataset, correlation results are reported for band ratios as compared with the periodic (left) and aperiodic (right) parameters for the (A) θ/β ratio, (B) θ/α ratio, and (C) α/β ratio. In A, these results show that the θ/β ratio is most strongly correlated with the aperiodic exponent, and less related to power in the θ or β. In contrast, B, C, show that any ratio measure that includes an α band is most strongly correlated to α power, meaning any α ratio is mostly reflecting just α power. CF: center frequency, PW: power, BW: bandwidth.

