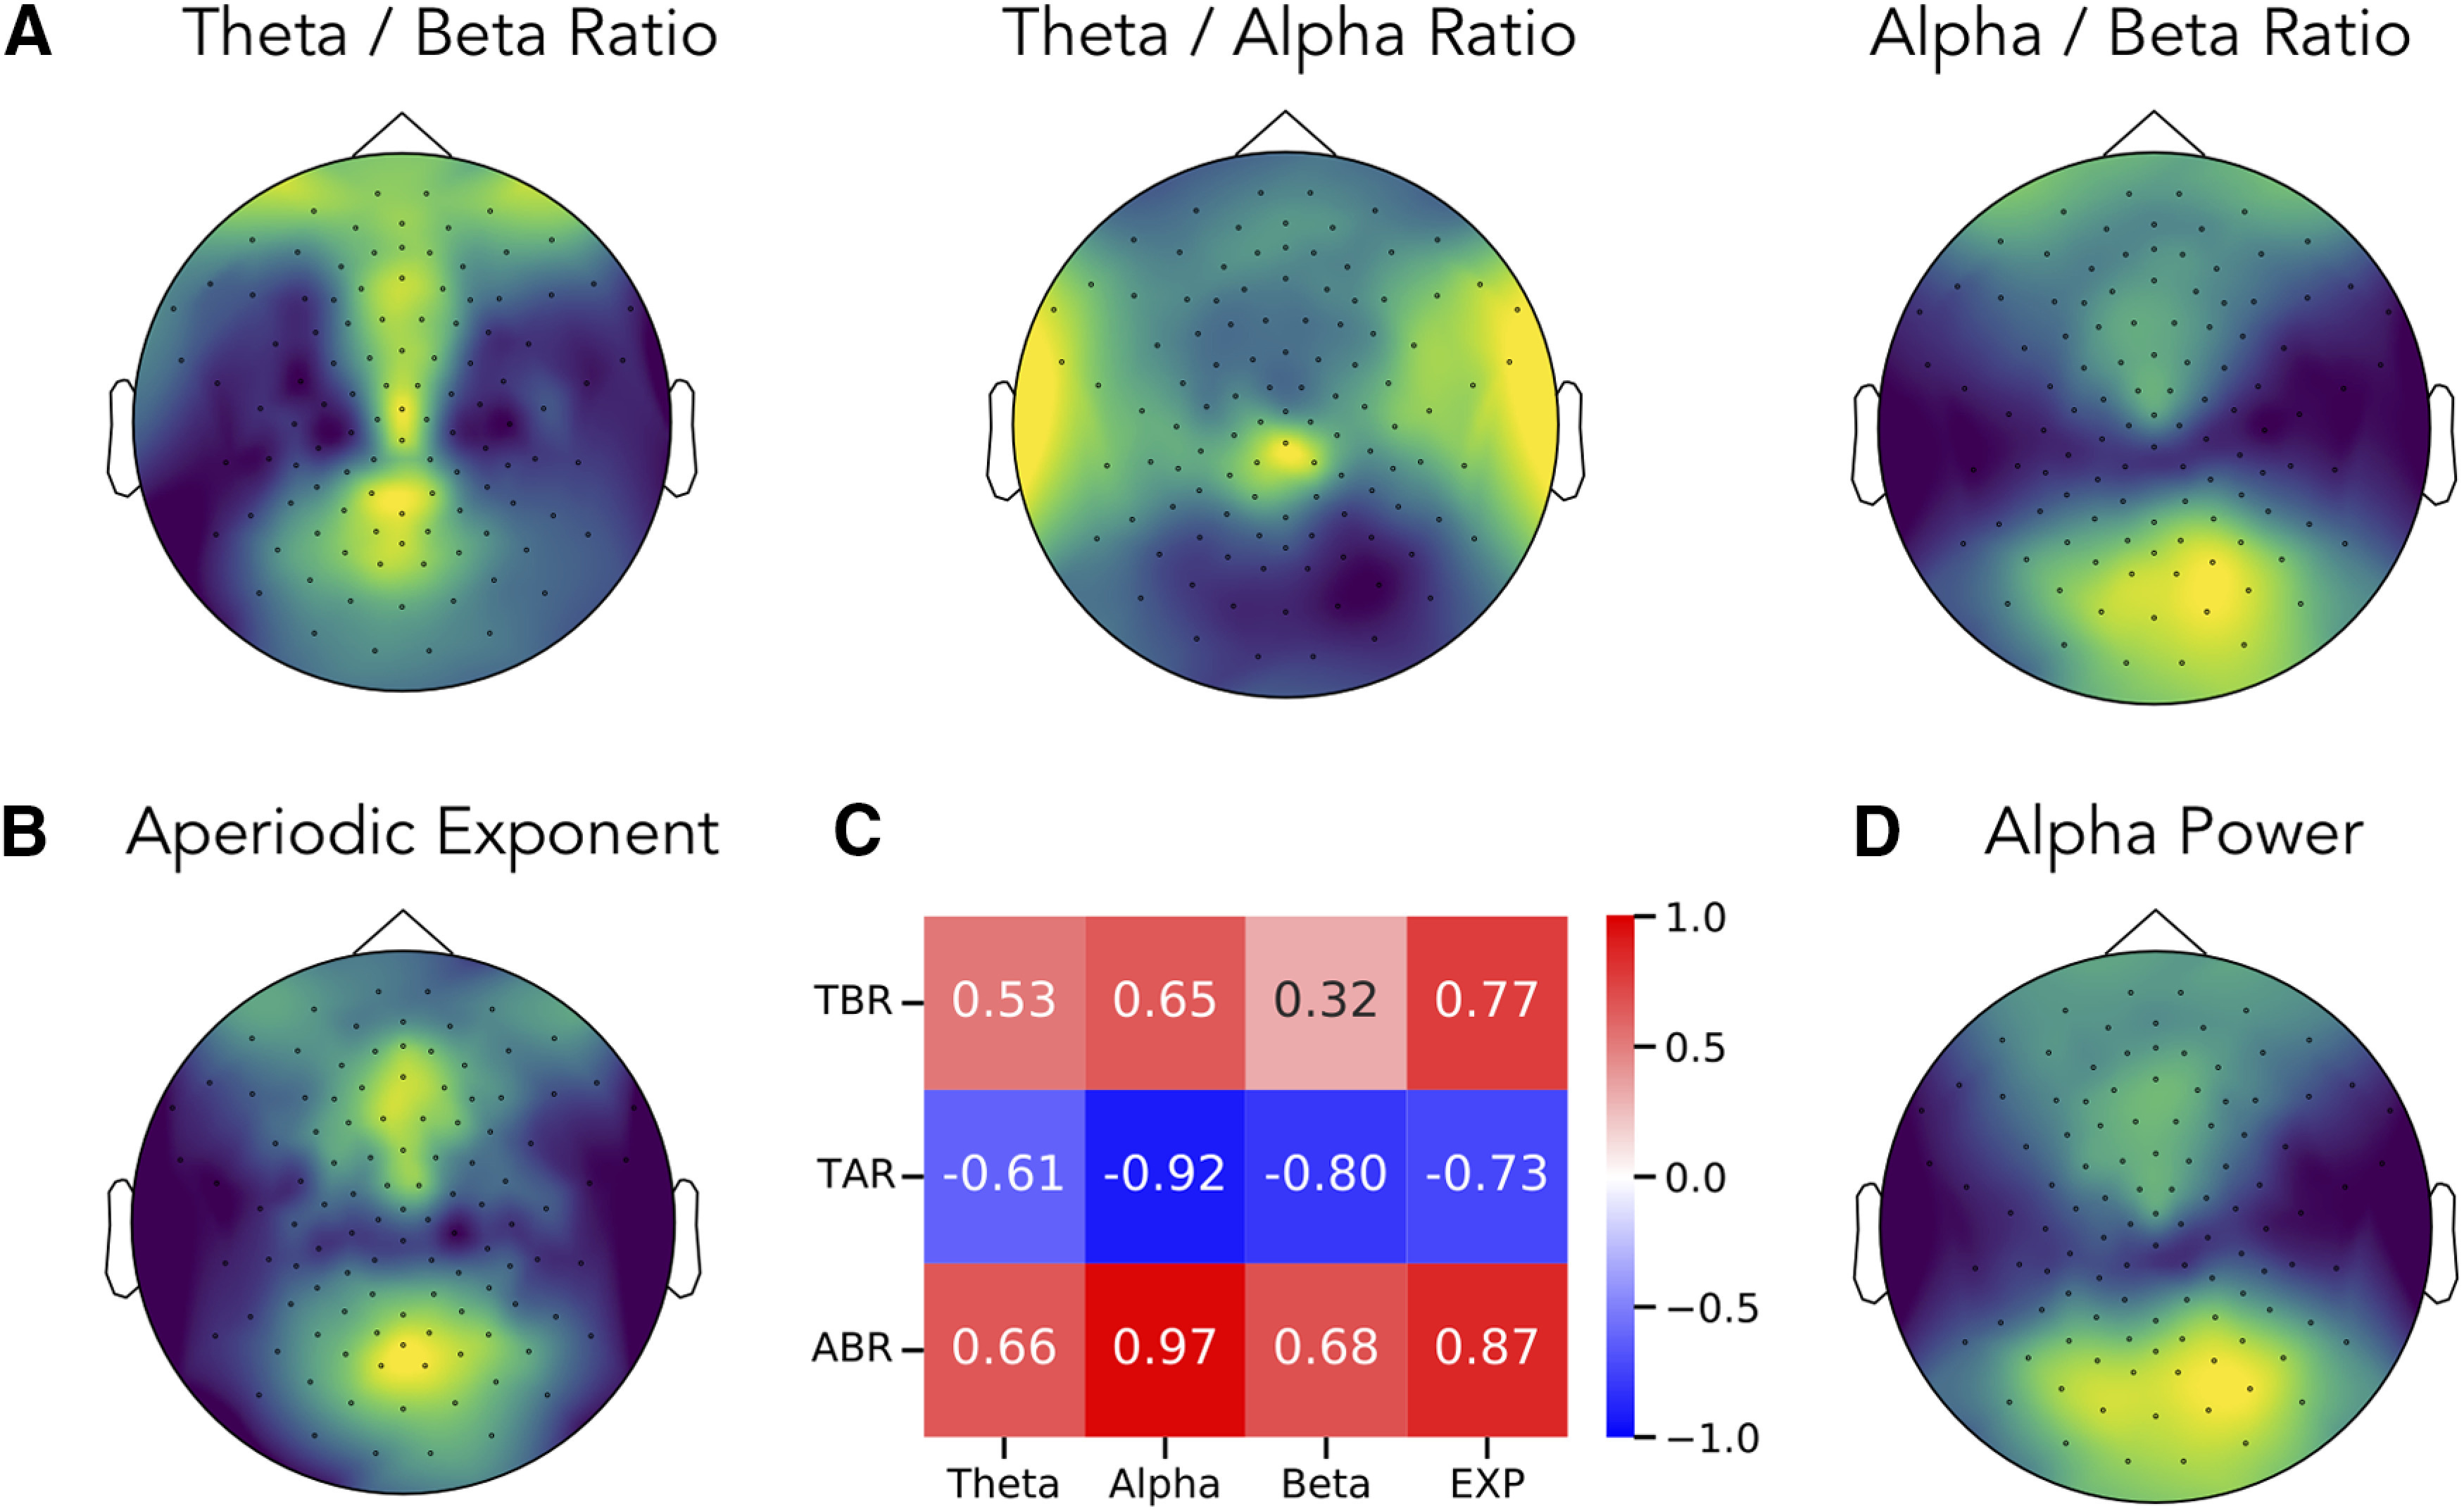
Figure 7.

Topographies of band ratio measures and spectral parameters. Topographical maps of the (A) ratios measures, including the θ/β ratio, θ/α ratio and α/β ratio. For comparison, the topographies of the aperiodic exponent (B) and of α power (D) are also presented. Each topography is scaled to relative range of the data, with higher values plotted in lighter colors (yellow). C, The spatial correlation between topographies of each ratio measure to spectral parameters including power of θ, α and β, and the aperiodic exponent (EXP). TBR: theta / beta ratio, TAR: theta / alpha ratio, ABR: alpha / beta ratio.
