
Figure 7.
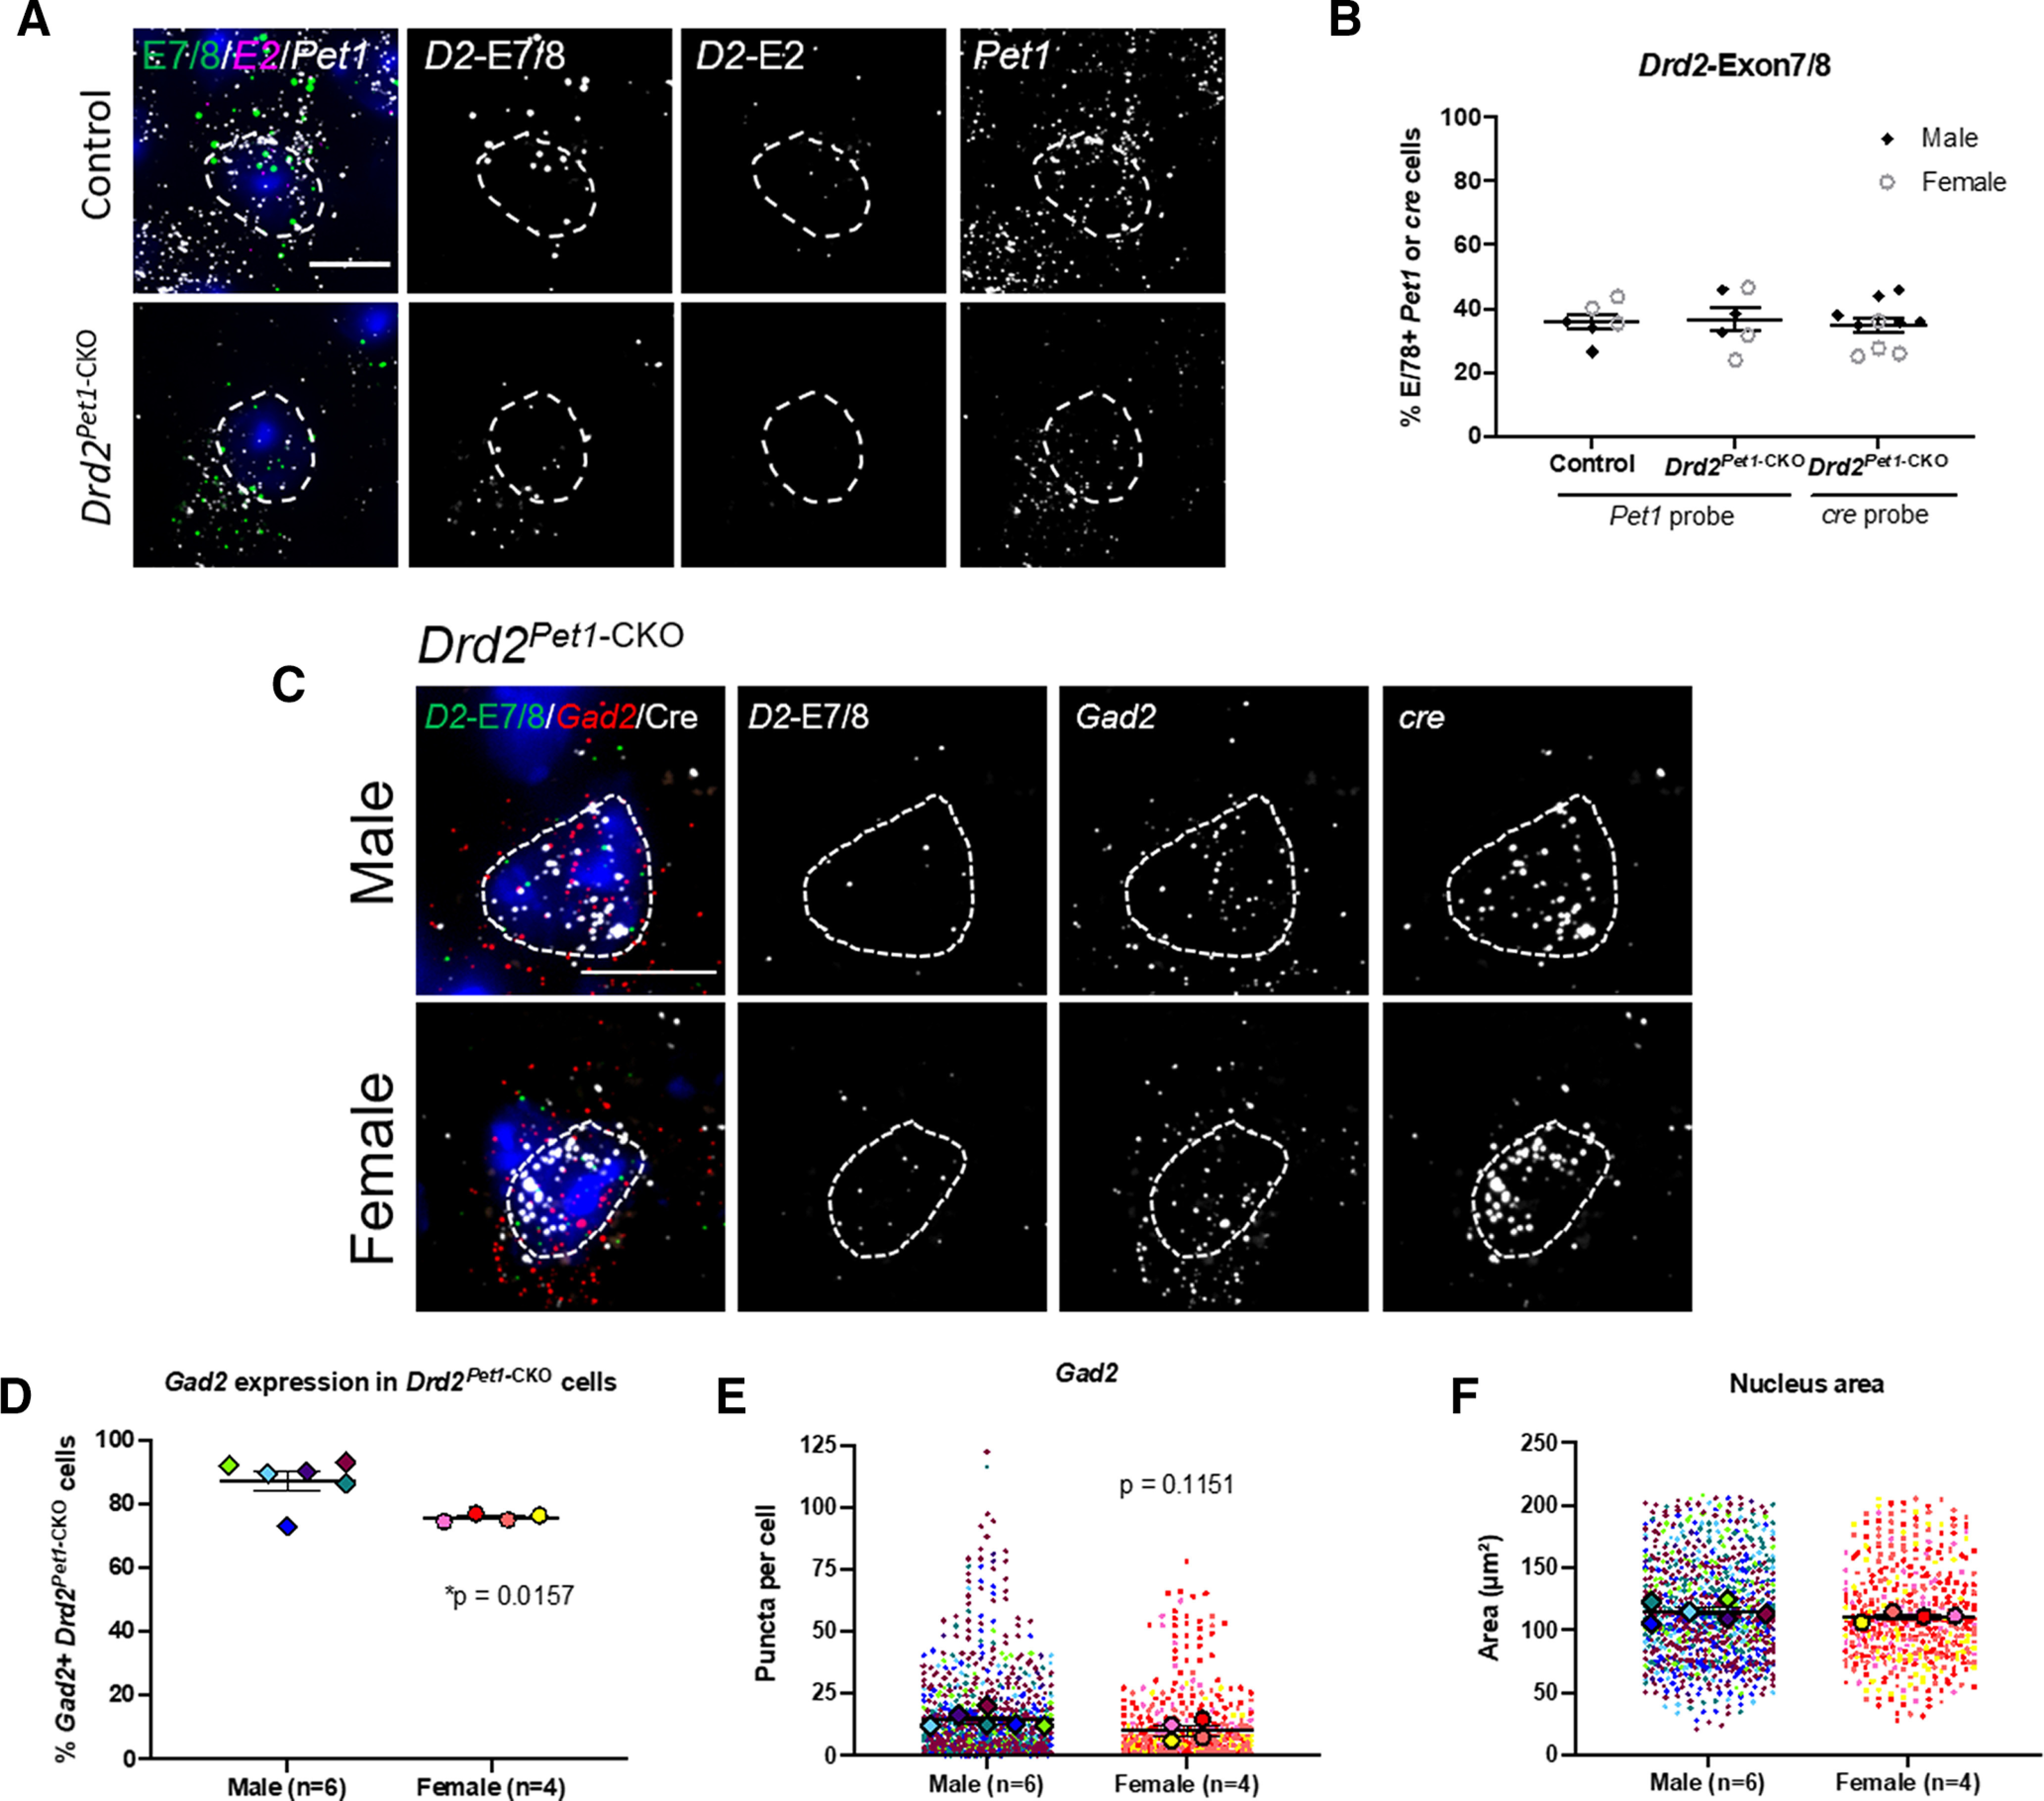
Gad2 expression in Drd2Pet1-CKO cells. A, FISH with probes to Drd2 exon 7/8 (D2-E7/8, green) and Drd2 exon 2 (D2-E2, magenta) in Pet1 (white) cells in control (top) and Drd2Pet1-CKO (bottom) DR tissue. D2-E7/8, D2-E2, and Pet1 expression shown together and separately in gray scale. B, Percent of Pet1+ cells (left and middle) with Drd2-Exon7/8 expression in control (35.97 ± 2.403%, n = 6) and Drd2Pet1-CKO (36.53 ± 3.621%, n = 6), p = 0.8998, unpaired t test. Data also shown for percent of cre cells (right) with Drd2-Exon7/8, 34.91 ± 2.238%, compared with Pet1 probe control and Drd2Pet1-CKO p = 0.9051, one-way ANOVA. Males, black diamonds, females, open gray circles. C, FISH showing cre+ Drd2Pet1-CKO cells (white) with Drd2-Exon7/8 (green) and Gad2 (red) in male (top) and female (bottom) in the DR nucleus. Drd2-Exon7/8, Gad2, and cre are shown together and separately in gray scale. Scale bar: 10 μm. D, A larger percentage of male Drd2Pet1-CKO cells (87.44 ± 3.034%) express Gad2 versus female Drd2Pet1-CKO cells (75.76 ± 0.5862%), *p = 0.0157, unpaired t test. E, Number of Gad2 mRNA puncta per cell in Drd2Pet1-CKO cells in males (n = 6) versus females (n = 4). Male cells have 14.25 ± 1.325 Gad2 puncta per cell compared with 10.13 ± 2.074 in female cells, p = 0.1151, unpaired t test. F, Drd2Pet1-CKO nucleus size (area used to quantify puncta levels) does not differ in males (n = 6 males) versus females (n = 4 females), p = 0.3497, unpaired t test. Error bars indicate SEM throughout. For E, F, larger symbols outlined in black represent animal averages used for statistical analysis, smaller symbols represent individual cells, matched in color to the average.