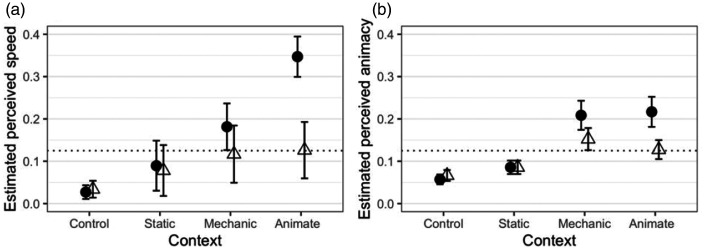
Figure 2.
(a) Perceived speed scale values for the different conditions in Experiment 1, derived from the EBA model fitted to the paired comparison data. (b) Perceived animacy scale values for the same conditions, estimated by Parovel et al. (2018). In both plots, the error bars represent 95% confidence intervals for the estimated values. The dotted lines indicate the location on the scale where all the stimuli would lie if, for each pair of stimuli, the probability of choosing one over the other as faster/more animate was 0.5 (i.e., if there were no difference in the perceived speed or animacy of the black square across the conditions).

