
FIG 2.
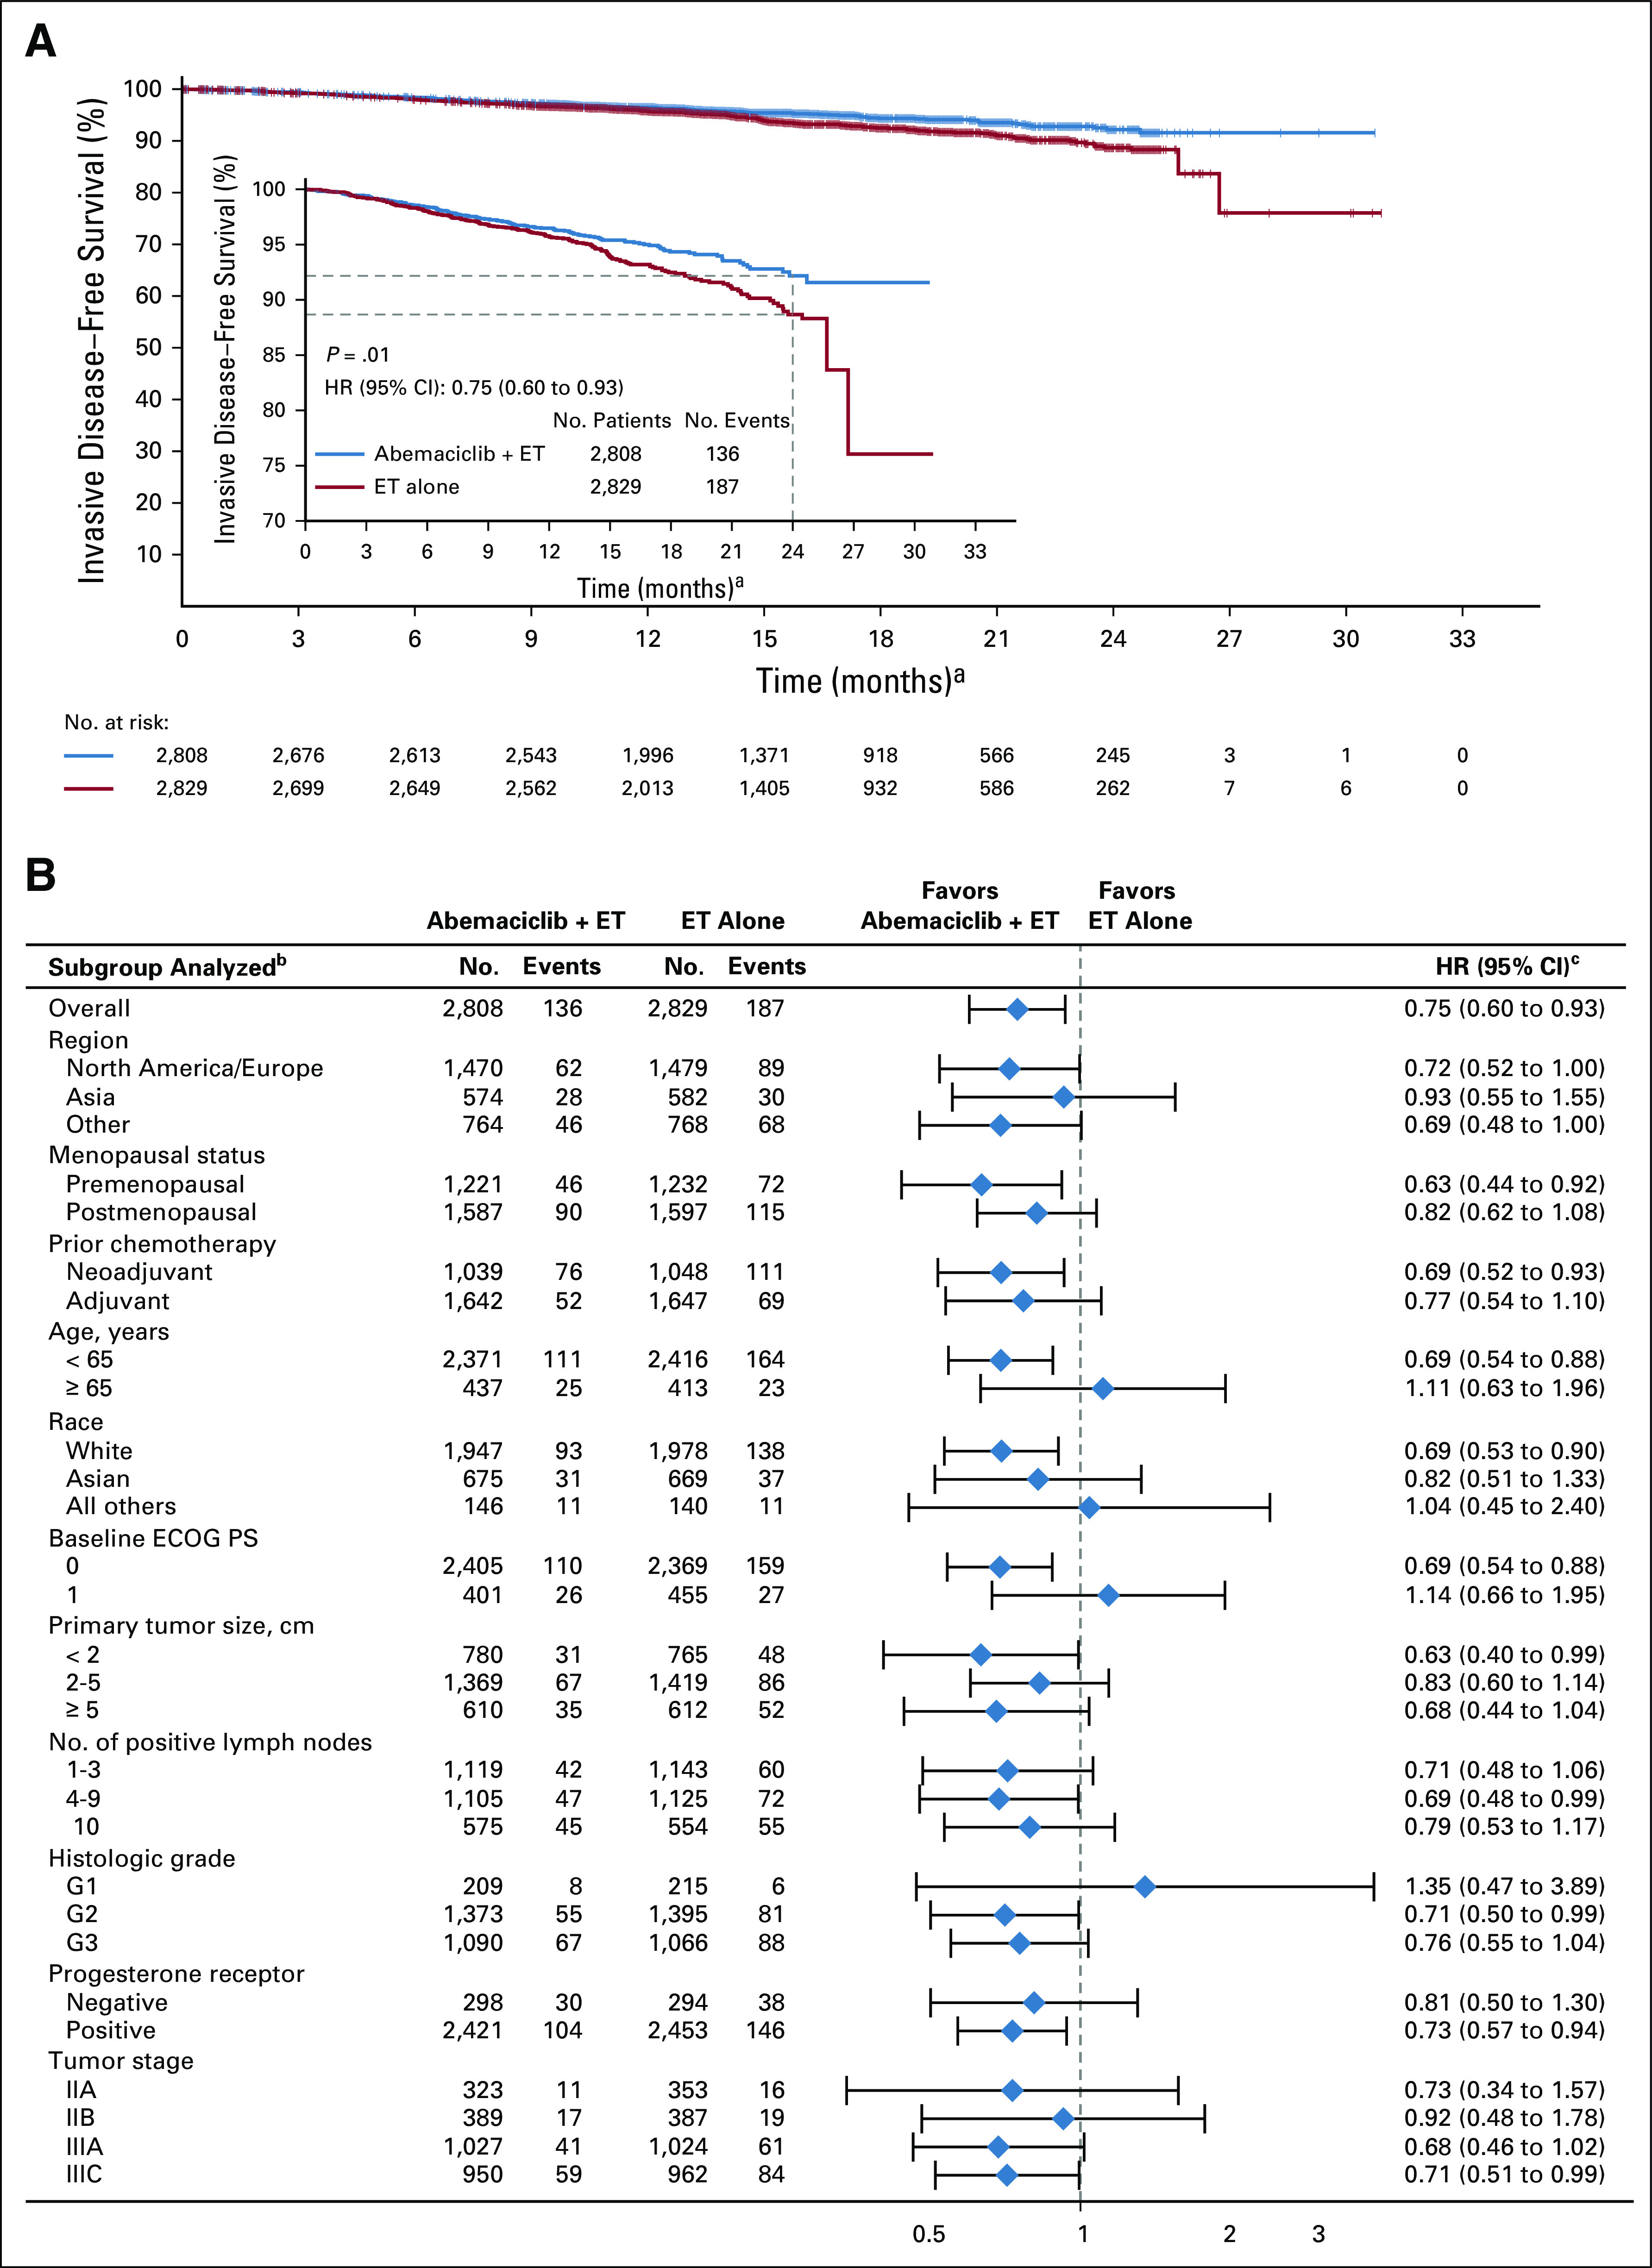
Invasive disease-free survival (IDFS). (A) Kaplan-Meier curves of IDFS and IDFS zoomed in to better visualize separation of the curves in the intent-to-treat population. (B) IDFS of patient subgroups. Hazard ratios (HRs) are stratified in overall population and unstratified in subgroups for abemaciclib plus endocrine therapy (ET) versus ET alone. HR estimates for IDFS are indicated by diamonds, and 95% CIs are indicated by the crossing horizontal lines. (a) Curves should not be interpreted beyond 24 months because of the limited follow-up. (b) If a subgroup consists of < 5% of randomly assigned patients, analysis within that subgroup was omitted. (c) The width of CIs in subgroups has not been adjusted for multiplicity; thus, the subgroup results are exploratory in nature. ECOG PS, Eastern Cooperative Oncology Group performance status.