Figure 1.
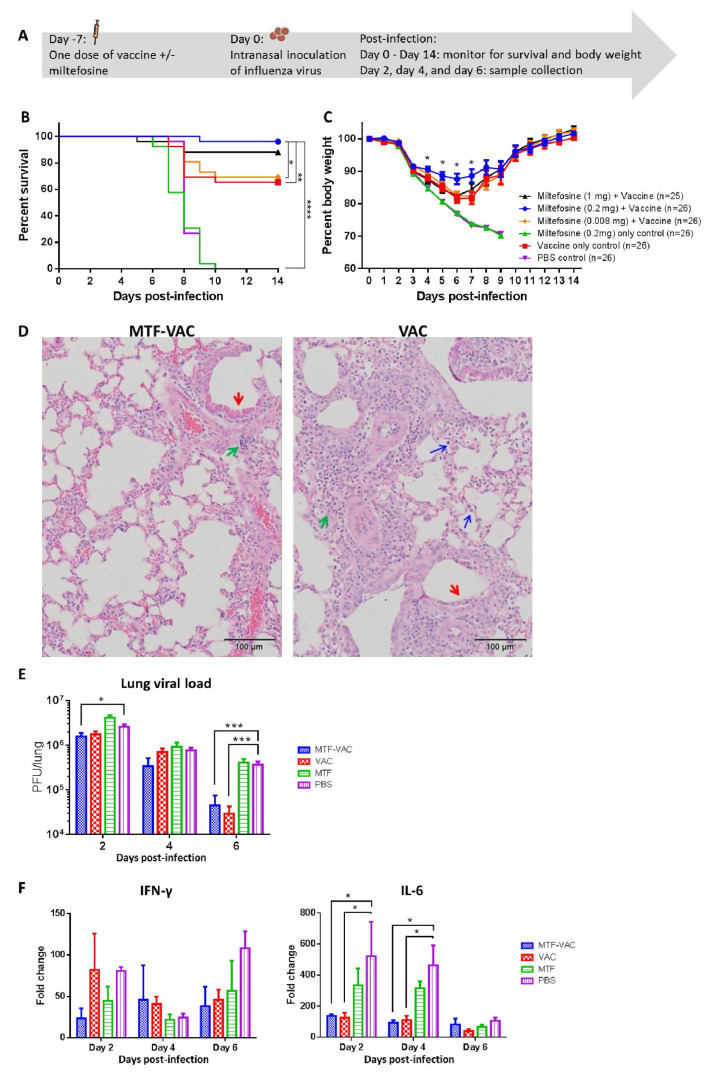
The effect of a single dose of vaccine on mice administrated 7 days before influenza virus challenge. Mice were vaccinated intraperitoneally with a split-virion influenza vaccine with or without miltefosine (MTF) in 200 µL. On the day of the virus challenge, 10LD50 of mouse-adapted A(H1N1)pdm09 virus was inoculated through the intranasal route in 40 µL. (A) Schedule of influenza vaccination, virus challenge, and sample collection. (B) Survival curve of mice. (C) Body weight curve of mice. (D) Representative hematoxylin and eosin (H&E) staining of lungs from MTF-adjuvanted vaccine (MTF-VAC) and VAC mice on 6 dpi; red arrows indicate epithelial cell layer damage in bronchioli; green arrows indicate lymphoid cell infiltration; blue arrows indicate monocytes and neutrophils entering alveolar space. (E) Pulmonary viral load post-infection (n = 6 per group). (F) Fold change of cytokine mRNA levels in lung tissue post-infection (n = 3 per group). For (D–F), MTF-VAC, miltefosine (0.2 mg) + vaccine group; VAC, vaccine only group; MTF, miltefosine (0.2 mg) only group; PBS, PBS only group. Data collected from 25–26 mice (4 independent experiments) for survival experiments. Log–rank (Mantel–Cox) test was used for survival comparison; multiple t-tests were used for body weight comparisons. Pulmonary viral load was determined by plaque assay and the statistical comparisons were conducted through multiple t-tests. Cytokine levels were assessed by RT-qPCR. Relative expression levels of target genes were normalized by β-actin expression level and fold change was calculated by comparing to naïve mice. Statistical comparisons were conducted by two-way ANOVA followed by a Tukey’s multiple comparison test. * for p < 0.05; *** for p < 0.001. Error bars represent standard error of the mean (SEM).

