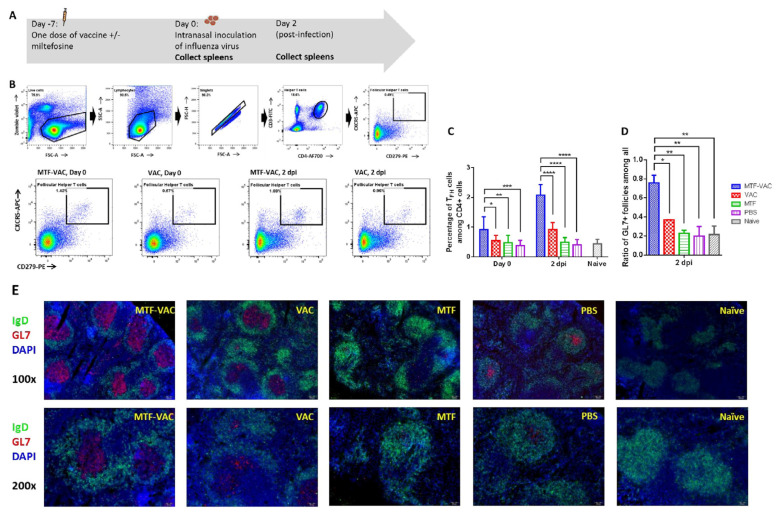
Figure 4.
The effect of MTF-VAC and VAC on mice spleens before and after influenza virus challenge. Groups of mice were immunized 7 days before a lethal virus challenge with MTF-VAC, Vac, MTF, or PBS. At day 0, 10LD50 of the 415742Md virus was inoculated through the intranasal route. Spleen samples were collected on day 0 and 2 dpi. Flow cytometry was applied for assessing frequencies of TFH cells with staining of Zombie Violet live/dead dye, anti-mouse CD3ε, anti-mouse CD4, anti-mouse PD-1, and anti-mouse CXCR5 antibodies. Frozen sections were prepared from 2 dpi spleen samples and stained with anti-mouse IgD and anti-mouse GL7 antibodies. The stained tissue slides were examined under the fluorescent microscope Olympus BX53. B cell follicles expressing IgD+GL7− or IgD+GL7+ were counted with randomly renamed photos to avoid bias. (A) Schedule of influenza vaccine, virus challenge, and spleen sample collection. (B) Gating strategy and representative flow cytometry profiles of splenic TFH cells obtained from mice. (C) TFH cell frequencies in mice spleens assessed by flow cytometry. (D) Percentage of GL7+ B cell follicles (GC) among all B cell follicles (IgD+) in spleen. (E) Representative immunofluorescence staining of mouse spleen. MTF-VAC, miltefosine (0.2 mg) + vaccine group; Vac, vaccine only group; MTF, miltefosine (0.2 mg) only group; PBS, PBS only group. Data collected from 8 mice per group (3 independent experiments) for (B,C). Data were collected from 3 mice per group (1 independent experiment) for (D,E). * for p < 0.05; ** for p < 0.01; *** for p < 0.001, **** for p < 0.0001; calculated by two-way ANOVA followed by a Tukey’s multiple comparison test. Error bars represent standard error of the mean (SEM).

