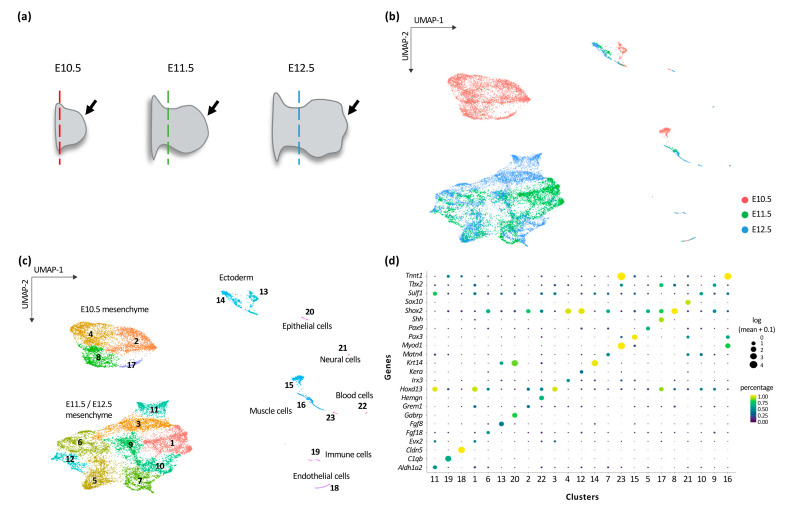
Figure 1.
Identification of the different cell identity in the developing mouse limb bud. (a) Schematics illustrating mouse forelimb buds tissues used in this study: E10.5 (left, black arrow), E11.5 (middle, black arrow) and E12.5 (right, black arrow). The dashed color lines mark the position of the dissection. (b,c) UMAP visualization of 18,935 mouse forelimb buds cells, colored by developmental stages (6008 cells for E10.5 in red; 5955 cells for E11.5 in green and 6972 cells for E12,5 in blue) (b) and by cluster identity from Leiden clustering (c). The clusters were annotated based on the identification of marker genes. (d) Dot plot showing the expression of one selected marker gene per cluster. The size of the dot represents the mean of the expression level of the gene and its color represents the percentage of cells within the cluster in which that gene was detected.

