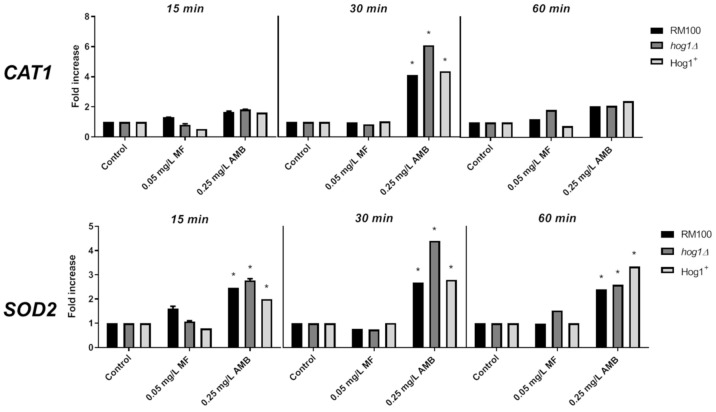
Figure 4.
Level of CAT1 and SOD2 mRNA transcripts in response to AMB and MF. Exponentially growing cells were treated with 0.25 mg/L AMB or 0.05 mg/L MF at 37 °C. Samples were collected at 15, 30, and 60 min and processed for RT-qPCR analysis. ACT1 mRNA transcript was used as the internal control, and CAT1 and SOD2 mRNA transcripts were detected using specific primers. The data shown are the mean ± SD of three independent experiments and normalized to untreated cultures at the same time point for each strain. * Two-fold induction or more was considered significant.

