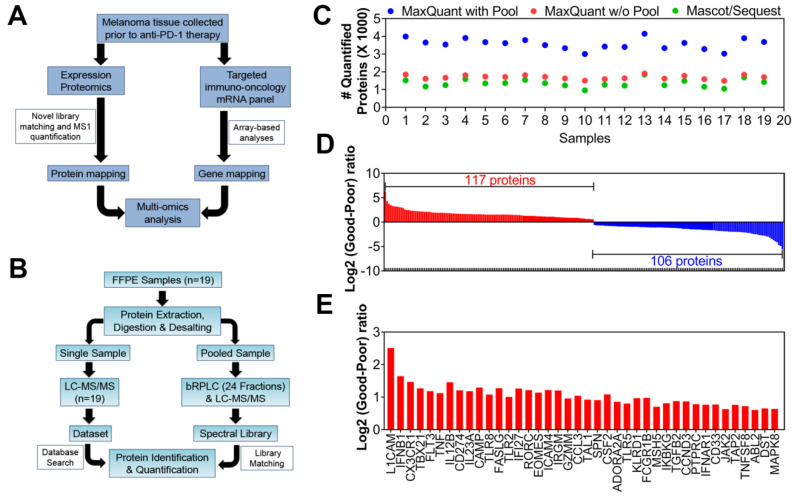
Figure 1.
Identification of differentially expressed genes and proteins associated with a favorable response to anti-PD-1 therapy. (A) Schematic of the multi-omics pipeline to analyze formalin-fixed, paraffin-embedded (FFPE) samples collected prior to anti-PD-1 therapy in melanoma patients. (B) Flow chart describing the library matching process used to significantly increase the identification of unique peptides. (C) Scatter plot illustrating the advantage of using library matching to quantify more protein groups by LC–MS/MS across all 19 FFPE samples. (D) Two group analyses of proteomics and genomics data were performed on log2 transformed and normalized signals. Averages were calculated for each group then subtracted to yield log2 ratios. Student’s t-tests (two-sided, unequal variance) and Hellinger distances were calculated to create a score to be used in the informatics pipeline to compare good (progression-free survival (PFS) >1 year) vs poor (PFS <1 year) responders. Two hundred twenty-three differentially expressed proteins (upregulated = blue/downregulated = red) were found in the MaxQuant output based on |log2 ratio| ≥ log2(1.5-fold change), t-test p value < 0.05, and Hellinger distance > 0.25. (E) A similar 2 group analysis was then performed on the targeted-mRNA dataset. Forty differentially expressed mRNAs (upregulated = blue) were found based on |log2 ratio| ≥log2(1.5-fold), t-test <0.05, and Hellinger distance >0.25 (Table S3).

