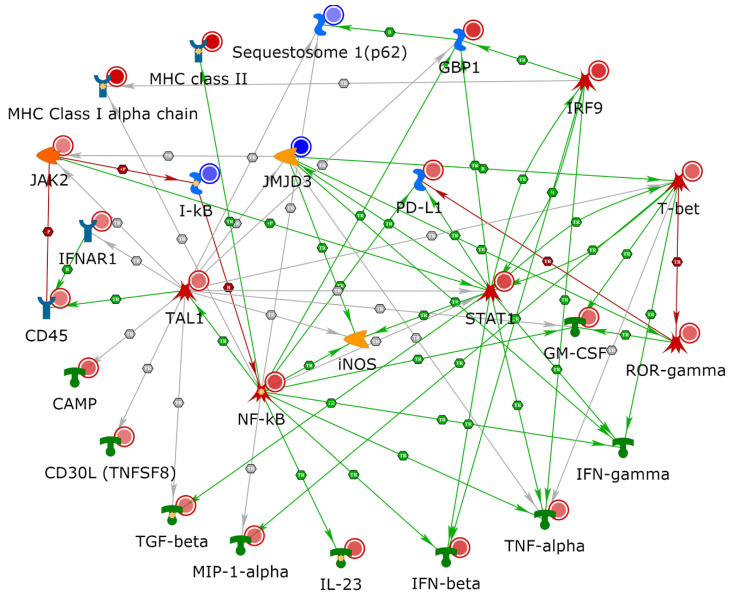
Figure 5.
Expansion of direct interactions among cumulative analysis. The cumulative network was derived from direct interaction between members with ≥3 connections of both datasets along with major cytokines. To represent the antigen presentation machinery, MHC class I and class II nodes were added, as was also seen in our data. Given these interactions, interferon (IFN)-γ and iNOS were added as network objects, and both of these objects have direct interactions with nodes found to be regulated in our experimental dataset.

