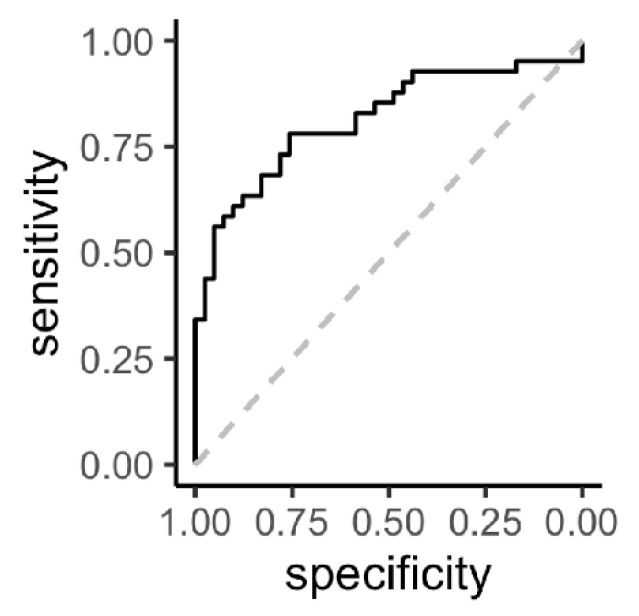
Figure 3.
Receiver operating characteristic (ROC) curve (black solid line) of prediction of insufficient response (DAS28-ESR > 3.2) including significantly different metabolites in relation to response at 3 months. Predictors included in the model were: baseline homocystine, glycerol-3-phosphate and 1,3-diphosphoglyceric acid/2,3-diphosphoglyceric acid. The grey dotted line represents “the line of no discrimination”.

