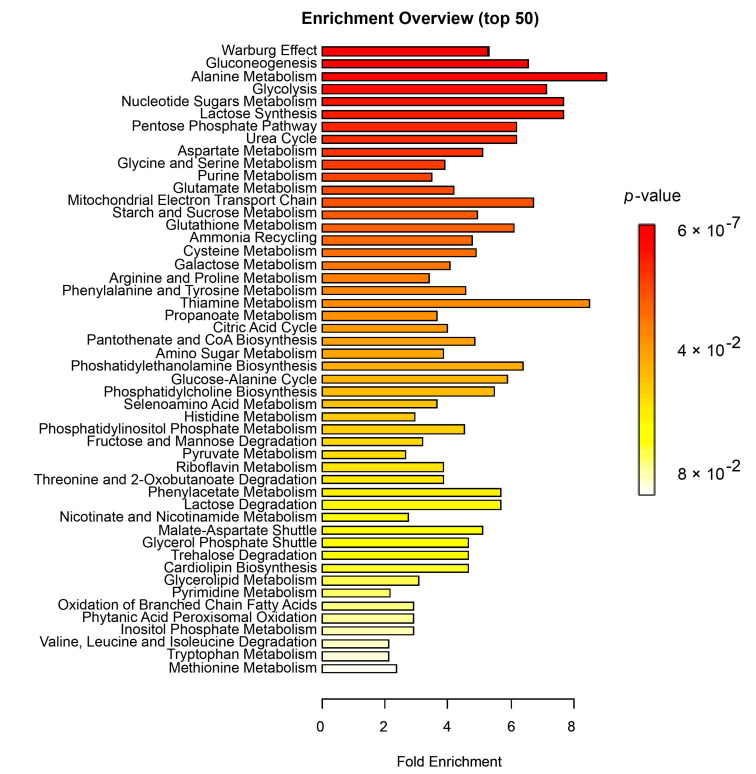
Figure 5.
Results of overrepresentation analysis (ORA) between insufficient and sufficient responders to MTX. Summary of overrepresentation analysis results at baseline in relation to response to MTX at 3 months. The X-axis shows the fold enrichment between response groups and the color indicates the significance level, where red is most significant. p-values < 0.05 were considered significant. For details on the number of metabolites per pathway, see Supplementary Table S2.

