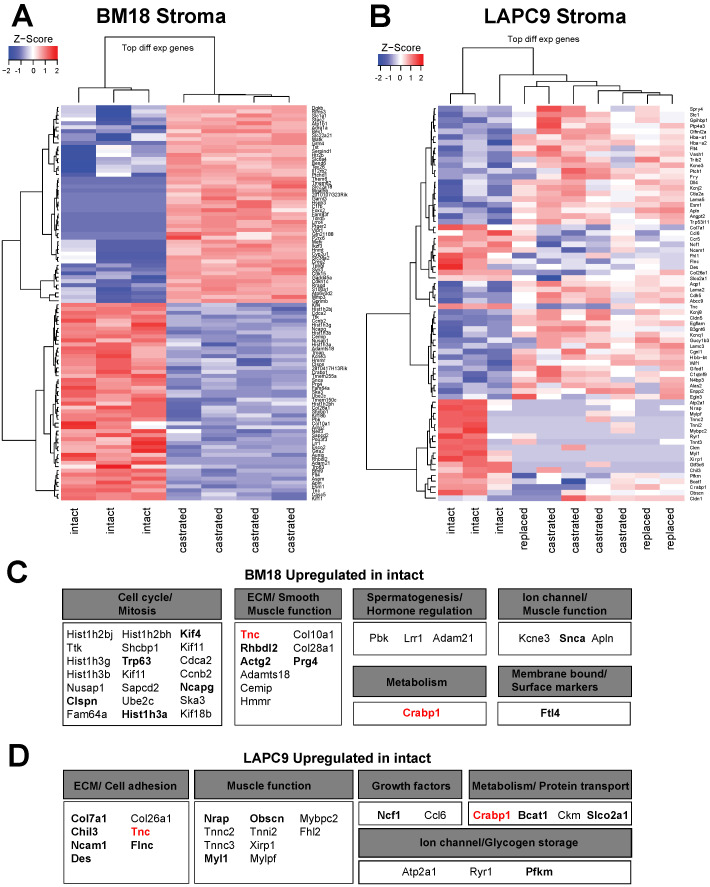
Figure 4.
Differential expression analysis of the transcriptome indicates different expression profiles of stromal genes as response to androgen deprivation. (A) Heatmap represents a differential expression analysis of the most variable genes from the mouse transcriptome of BM18 castrated compared to BM18 intact tumors. Genes modulated by androgen deprivation due to castration in the up/downregulation compared to intact tumors are indicated in red or blue colors, respectively. (B) Heatmap represents Z-score of the differential expression analysis of most variable genes in the mouse transcriptome of LAPC9 castrated (with and without androgen replacement) compared to LAPC9 intact tumors. (C) Description of mouse genes found upregulated in BM18 intact tumors and the biological processes they are involved in, according to the Gene Ontology (GO) terms. (D) Description of the mouse genes found upregulated in LAPC9 intact tumors and the biological processes they are involved in, according to the GO terms.

