Figure 6.
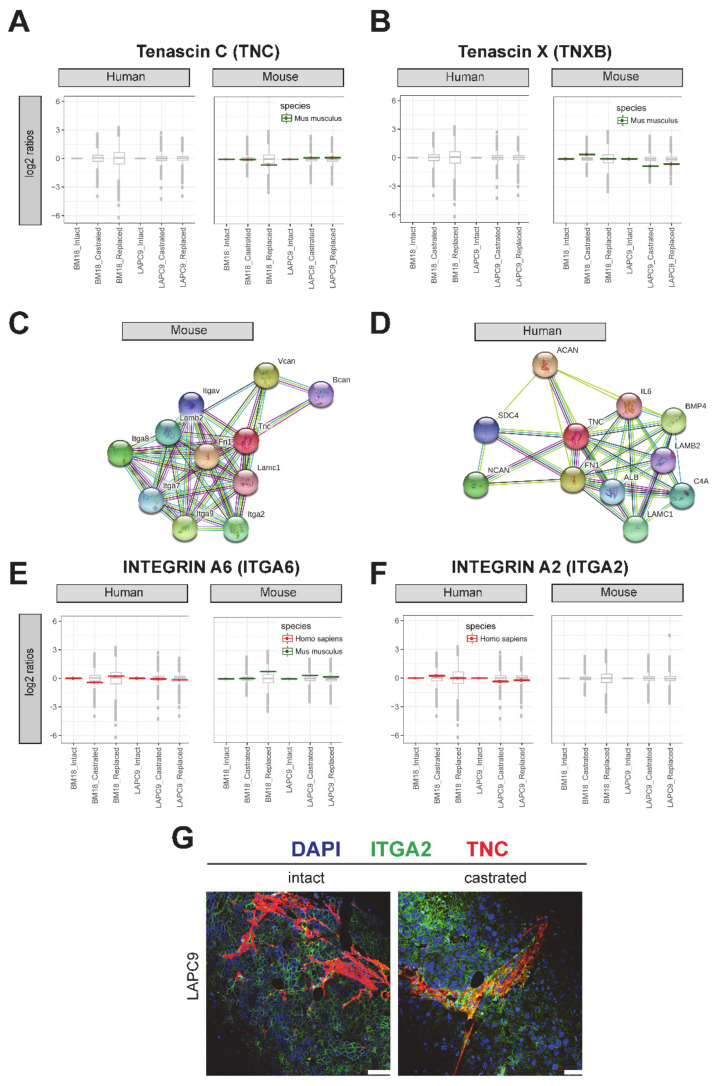
Tenascin C and its predicted interaction partners analyzed by mass spectrometry. (A) Tenascin C (TNC) and (B) alternative isoform Tenascin X (TNXB) protein relative abundance (log2 ratios; single replicates per sample from a pool of n = 3 to 4) in human cell isolations (left) and present in mouse cell isolations (right). The variance stabilization normalization (vsn)-corrected TMT reporter ion signals were normalized by the intact conditions of either BM18 or LAPC9. The protein sequences were predicted as mouse-specific (green). (C) Protein interaction network of the mouse TNC protein based on the STRING association network (https://string-db.org/). (D) Protein interaction network of the human TNC protein based on the STRING association network https://string-db.org/. (E) Predicted TNC-binding partner integrin A6 (ITGA6) was detected by mass spectrometry in both the human and mouse protein lysates and matching the organism-specific protein sequence based on the bioinformatics analysis (red for human and green for mouse). (F) Predicted TNC-binding partner integrin A2 (ITGA2) was detected by mass spectrometry, specifically in the human protein lysates, and matched the human-specific protein sequence. (G) Spatial localization of the Tenascin protein (TNC, indicated in red) and integrin A2 (ITGA2, green) assessed by immunofluorescent co-labeling in LAPC9 intact and castrated tumors. DAPI marks the nuclei. Scale bars: 50 μm.

