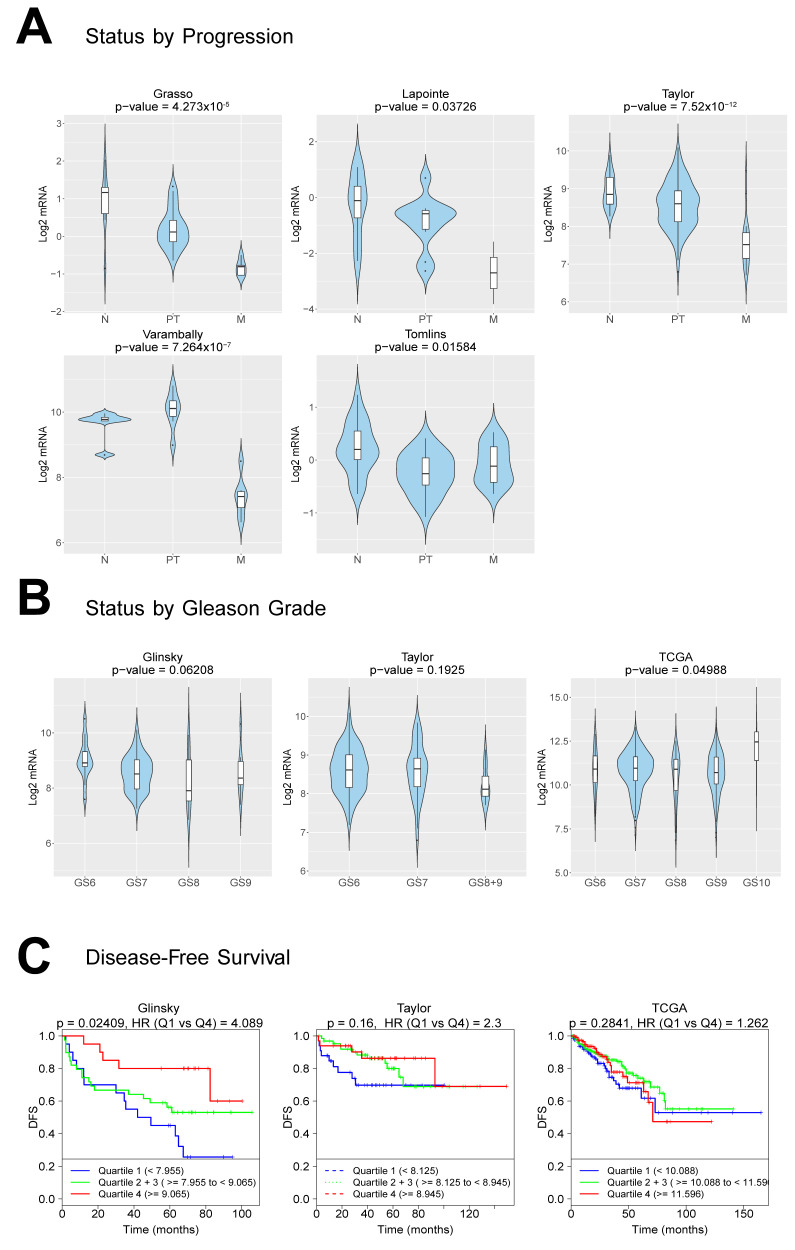
Figure 8.
TNC RNA expression is inversely correlated with the disease progression, Gleason score and survival. (A) Violin plots depicting the expression of TNC among nontumoral (N), primary tumor (PT) and metastatic (M) PCa specimens in the indicated datasets. The Y-axis represents the Log2-normalized gene expression (fluorescence intensity values for microarray data or sequencing read values obtained after gene quantification with RNA-Seq Expectation Maximization (RSEM) and normalization using the upper quartile in case of RNA-seq). An ANOVA test is performed in order to compare the mean gene expression among two groups (nonadjusted p-value), obtained by a CANCERTOOL analysis. (B) Violin plots depicting the expression of TNC among PCa specimens of the indicated Gleason grade in the indicated datasets. The Gleason grades are indicated as GS6, GS7, GS8, GS8+9, GS9 and GS10. An ANOVA test is performed in order to compare the mean among groups (nonadjusted p-value), obtained by a CANCERTOOL analysis. (C) Kaplan-Meier curves representing the disease-free survival (DFS) of patient groups selected according to the quartile expression of TNC. Quartiles represent ranges of expression that divide the set of values into quarters. Quartile color code: Q1 (Blue), Q2 plus Q3 (Green) and Q4 (Red). Each curve represents the percentage (Y-axis) of the population that exhibits a recurrence of the disease along the time (X-axis, in months) for a given gene expression distribution quartile. Vertical ticks indicate censored patients. Quartile color code: Q1 (Blue), Q2 plus Q3 (Green) and Q4 (Red). A Mantel-Cox test is performed in order to compare the differences between curves, while a Cox proportional hazards regression model is performed to calculate the hazard ratio (HR) between the indicated groups. Nonadjusted p-values are shown. Analysis obtained by CANCERTOOL.

