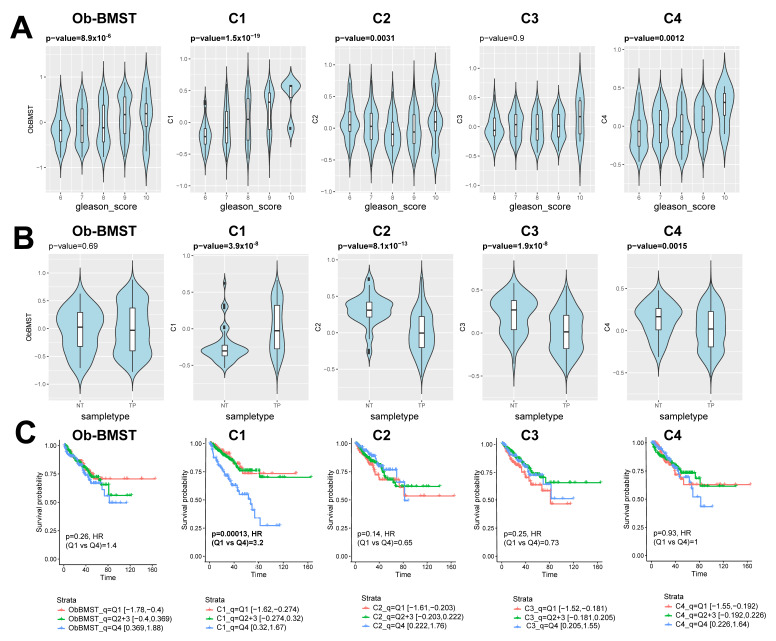
Figure 9.
Stroma signatures identified from bone metastatic PDXs as prognostic biomarkers in primary PCa. (A) Violin plots showing Gene Set Variation Analysis (GSVA) signature scores of the Ob-BMST, C1-C4 gene sets, stratified by Gleason score from the TCGA cohort. Box-and-whisker plots illustrating median (midline), inter-quartile range (box), with the whiskers extending to at most 1.5 IQR from the box. Outliers beyond the range of the whiskers are illustrated as dots. P-values computed by Spearman correlation tests. (B) Violin plots showing GSVA signature scores of the Ob-BMST and C1-C4 gene sets stratified by sample types (NT: nontumor and TP: primary tumor) from the TCGA cohort. Box-and-whisker plots illustrating the median (midline) and interquartile range (box), with the whiskers extending to at most 1.5 IQR from the box. Outliers beyond the range of the whiskers are illustrated as dots. P-values computed by Mann-Whiney U tests. (C) Kaplan-Meier plots of progression-free survival (PFS) stratified as the bottom 25% (Q1), middle 50% (Q2 and 3) and top 25% (Q4) of the signature scores of the Ob-BMST and C1-C4 gene sets. P-values and hazard ratios computed by Cox proportional hazard regression.

