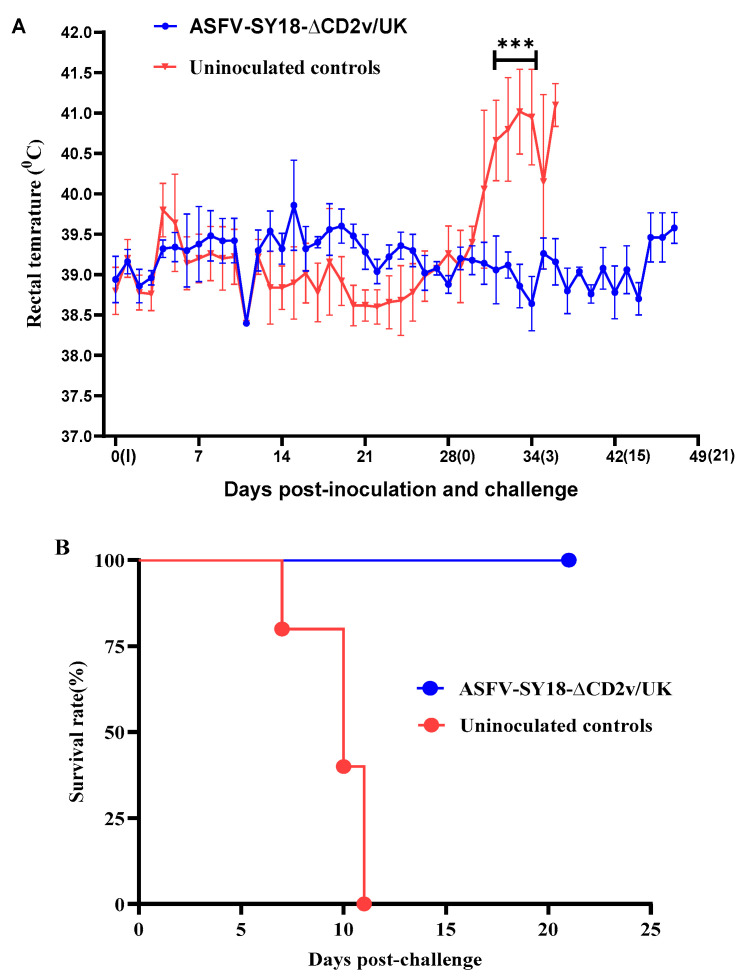
Figure 3.
Rectal temperature and survival of the pigs following inoculation and challenge. (A) Rectal temperature (y-axis) for each group of pigs following inoculation and challenge. The date of inoculation (I) and challenge (0) are shown on the x-axis. Black asterisks indicate statistically significant differences between groups (** p < 0.001) and error bars represent the standard deviations. (B) Survival rate of the pigs inoculated with ASFV-SY18-∆CD2v/UK or control pigs after challenge with the parent virus.

