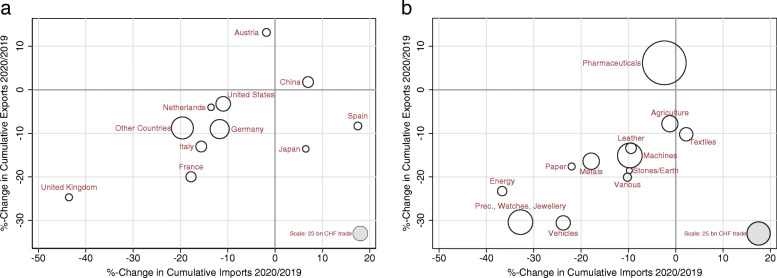
Fig. 3.
Cumulative exports and imports during the COVID-19 crisis by trading partners and product groups, first half of 2020. Note: Nominal and non-seasonally adjusted monthly data for Switzerland. The figures show the percentage change in cumulative exports (y-axis) and imports (x-axis) from January to June 2020 (i.e., calendar weeks 1 to 26) compared to the same period in 2019. Marker sizes indicate the relative trade volumes (exports + imports) in 2020. See Table 1 for details on the different trading partners and product groups. Source: FCA

