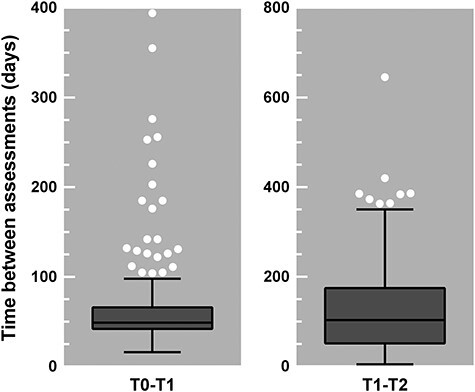
Fig. 1.

Tukey box-and-whisker plots showing the distribution of the time between two assessments in days. The time between T0 (intake or clinical admission) and T1 (after 6 weeks of clinical admission) ranged from 16 to 394 (left panel), and the time between T1 (after 6 weeks of clinical admission) and T2 (clinical discharge) ranged from 5 to 645 (right panel). The box plots indicate the interquartile range and median; the whiskers indicate the minimum and maximum values, excluding the outliers which are represented by the white circles.
