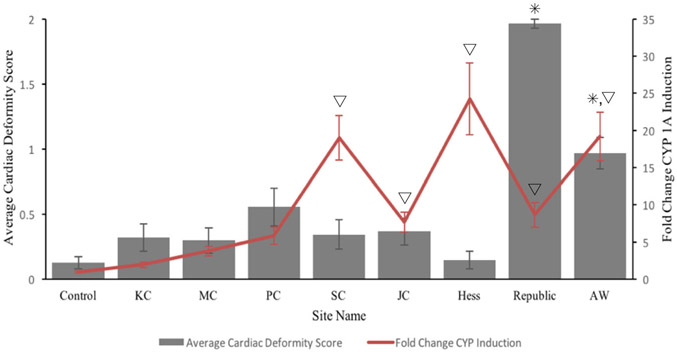
Fig. 2.
King’s Creek embryonic cardiac deformities and induction of cytochrome P4501A (CYP1A) with exposure to sediment extracts from seven sites along the Elizabeth River and one reference site in the Severn River—King’s Creek (KC; n = 28). Elizabeth river sites are Mains Creek (MC; n = 30), Pescara Creek (PC; n = 27), Scuffletown Creek (SC; n = 29), Jones Creek (JC; n = 30), Hess/Eppinger & Russell/Money Point (Hess; n = 27), Republic Creosoting (Republic; n = 29), and the Atlantic Wood Industries (AW; n = 30). The Control site reflects an exposure that contained no sediment extract (n = 47). Gray bars represent average phenotypic cardiac deformity score, as calculated based on a 0–2 point weighted scale (left y-axis). The red line indicates the induction of CYP1A based on the EROD assay and is represented as fold changes from control values. The visual representation of a line does not indicate connectedness between site values. Triangles denote statistically significant (p ≤ 0.05) differences in responses to CYP1A induction from the control. Asterisks denote statistically significant differences in average cardiac deformities from the control

