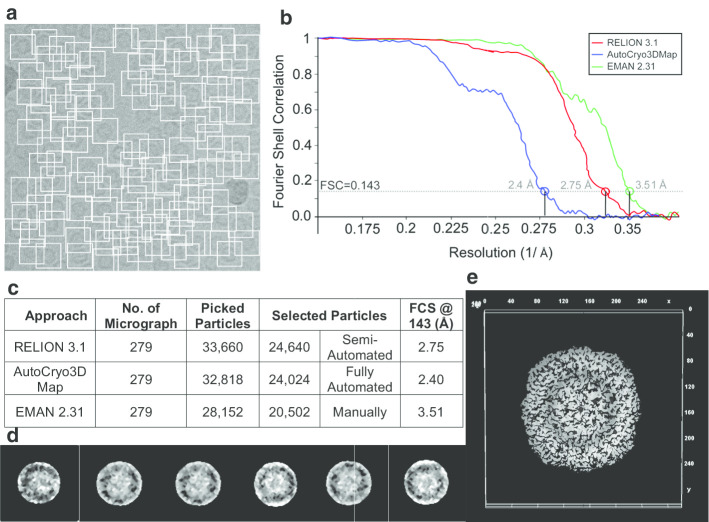
Fig. 18.
Top-view molecular structural analysis using the Apoferritin dataset. a Particles picking from the Apoferritin micrograph using DeepCryoPicker [10]. b Fourier shell correlation plots for the final 3D reconstruction. The red curve is based on using the RELION 3.1 [8], the blue is based on using Auto3DCryoMap, and the green one is based on using EMAN 2.31 [7]. The average resolution of our 3D density map reconstruction using Auto3DcryoMap is ~ 2.4 Å, whereas that one generated from RELION is ~ 2.75 Å and EMAN 2.31 is ~ 3.51 Å. c Summary of particle selection and structural analysis. d The preprocessed versions of the top-view particles that are used to generate the 3D density map structure. e 3D density map reconstruction of Apoferritin top-view protein that is obtained by the Auto3DCryoMap

