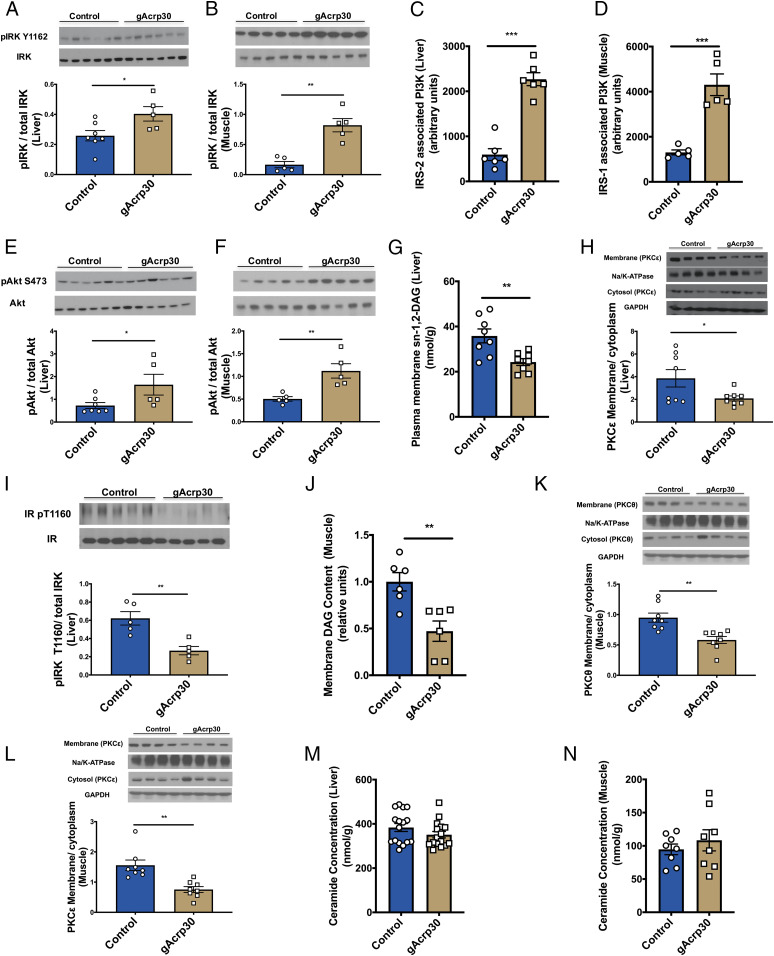
Fig. 2.
Globular adiponectin reduces membrane DAG content and nPKC activation in liver and muscle. (A and B) Western blot images for insulin receptor kinase phosphorylation (pY1162) in liver (n = 5–7) and skeletal muscle (n = 5) of control and gAcrp30-treated mice under the hyperinsulinemic-euglycemic clamp condition. Quantification is shown below. (C) IRS-2–associated PI3K activity in liver. (D) IRS-1–associated PI3K activity in muscle (n = 5). (E and F) Western blot images for Akt phosphorylation (pS473) in liver (n = 5–7) and skeletal muscle (n = 5) in the clamp state. Quantification is shown below. (G) Hepatic plasma membrane sn-1,2-DAG content. (H) Hepatic membrane/cytosolic PKCε ratio. Quantification is shown below. (I) Western blot images for insulin receptor kinase phosphorylation (pY1160) in liver (n = 5). Quantification is shown below. (J) Membrane DAG content in skeletal muscle. (K and L) Membrane/cytosolic PKCθ and PKCε ratio in skeletal muscle. PKCθ and PKCε were probed from the same membrane and therefore have the same corresponding loading controls (GAPDH and Na/K-ATPase). Quantification is shown below. (M and N) Total ceramide content in liver (n = 16) and skeletal muscle. Data are shown as mean ± SEM *P < 0.05, **P < 0.01, ***P < 0.001 by unpaired Student’s t test.

