Fig. 3.
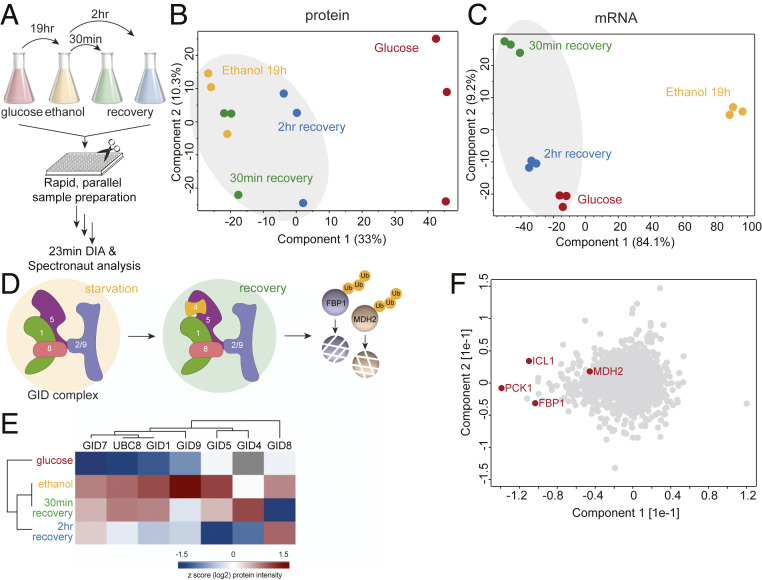
Global proteome changes of yeast under glucose starvation and recovery. (A) Rapid yeast proteome profiling under glucose starvation and recovery. (B and C) PCA plot of growth conditions along with their biological replicates based on their protein expression (B) and mRNA abundance (C) profiles. (D) The GID E3 ubiquitin ligase is a key regulator of the switch from gluconeogenic to glycolytic growth as it degrades the gluconeogenic enzymes, including Fbp1 and Mdh2. (E) Heat map of z-scored protein abundances (log2) of the GID complex subunits under glucose starvation and recovery in wild-type yeast cells. (F) PCA plot of proteins during glucose starvation and recovery. Proteins marked in red represent the known GID complex substrates.

