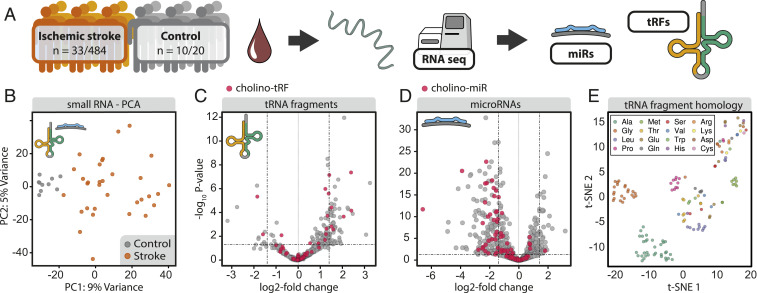
Fig. 1.
Poststroke differential expression of small RNA species and tRF homology clustering. (A) Whole-blood total RNA samples were collected on day 2 poststroke from patients of the PREDICT cohort (NCT01079728) (16) and age-matched controls. (B) PCA of DE tRFs/miRs in patients’ blood separated stroke and control samples. (C) Volcano plot of DE tRFs from stroke patients and controls (horizontal line at adjusted P = 0.05) showing up-regulation of most DE tRFs. (D) Volcano plot of DE miRs shows predominant down-regulation in stroke patients compared with controls (horizontal line at adjusted P = 0.05). Red dots in C and D reflect Cholino-tRFs and Cholino-miRs, respectively. (E) t-SNE visualization of tRF homology based on pairwise alignment scores of sequences of all detected tRFs shows grouped tRFs of several specific amino acid origins.

