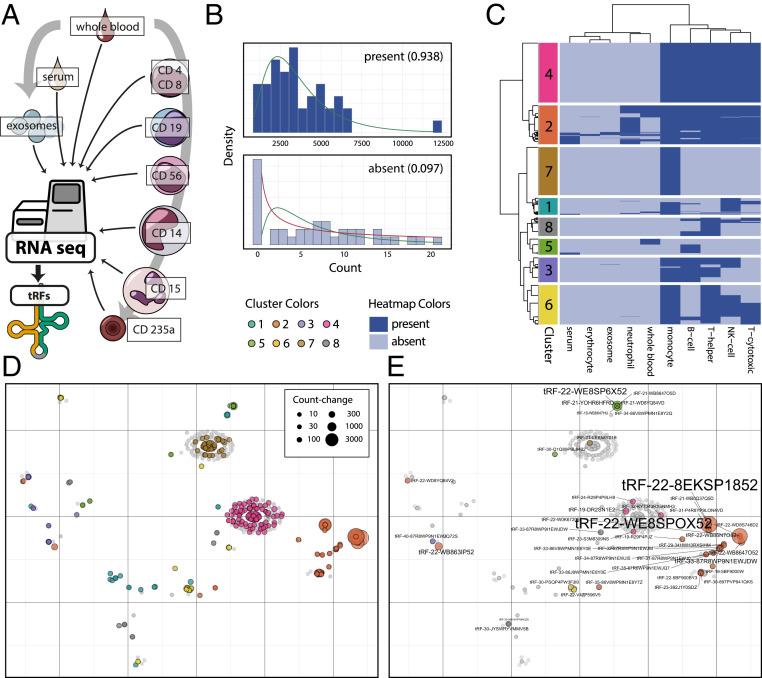
Fig. 3.
Immune cell tRF expression clustering and cell type-specific analysis. (A) Analysis of RNA-seq datasets from T lymphocytes (CD4+ T helper cells and CD8+ T cytotoxic cells), B lymphocytes (CD19+), NK cells (CD56+), monocytes (CD14+), neutrophils (CD15+), erythrocytes (CD235a+), serum, exosomes, and whole blood (24) yielded a blood tRF profile. (B) Definition of presence/absence of small RNAs in these blood compartments via statistical assertion of log-normal count distribution (values between 0 and 1, closer to 1: present). (C) Detailed analysis of identified tRFs found eight subclusters based on cell types expressing specific molecules. (D) t-SNE of all found tRFs represented by gray dots, DE tRFs identified in the PREDICT study are marked with cluster-specific color. (E) t-SNE of all tRFs found, Cholino-tRFs identified in the PREDICT study are marked with cluster-specific color.

