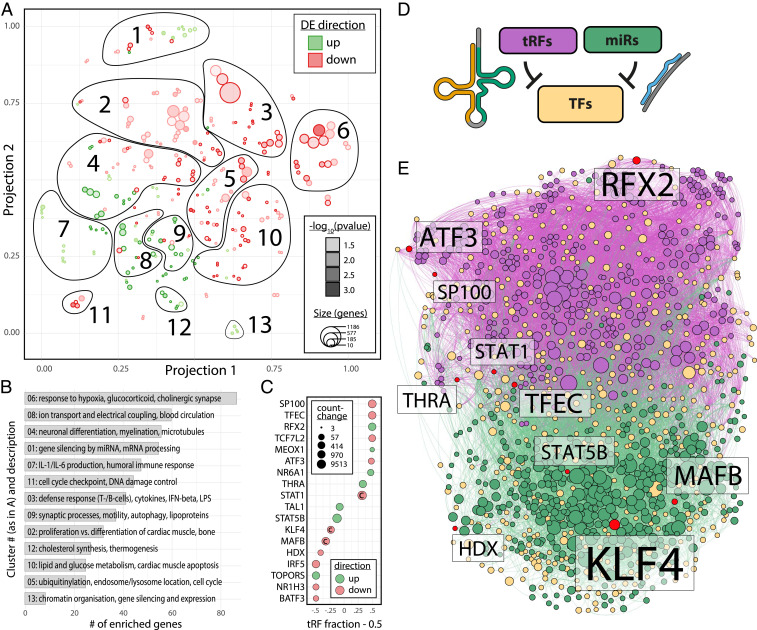
Fig. 5.
GO enrichment of miR targets and perturbed pathways; divergent influence of miRs and tRFs in CD14+ TF regulatory circuits. (A) t-SNE visualization of GO terms enriched in the targets of miRs perturbed by stroke, performed separately for positively (green) and negatively (red) perturbed miRs, segregated into 13 functional clusters. Size of circles represents the number of genes in the respective GO term; depth of color represents enrichment P value (all P < 0.05). (B) Bar graph of clusters identified in A ordered by the number of enriched genes (Fisher’s exact test, Benjamini–Hochberg adjusted P < 0.05) shows most pertinent processes with miR involvement. (C) The top 18 DE TFs in stroke patients’ blood present a gradient of targeting by miRs and/or tRFs (left = 100% miR targeting, right = 100% tRF targeting; value shown as “tRF fraction – 0.5” to center on 50/50 regulation by miRs and tRFs). Size of points and color denote absolute count-change and direction of differential regulation, respectively. “C” marks TFs targeting cholinergic core or receptor genes. (D) Small RNA targeting of TFs active in CD14+ cells was analyzed using miRNeo (19). (E) Force-directed network of all TFs active in CD14+ monocytes self-segregates to form largely distinct TF clusters targeted by DE tRFs and miRs in stroke patients’ blood. Yellow = TF, red = TF DE in stroke patients’ blood, green = miR, purple = tRF. Size of node denotes activity toward targets.

