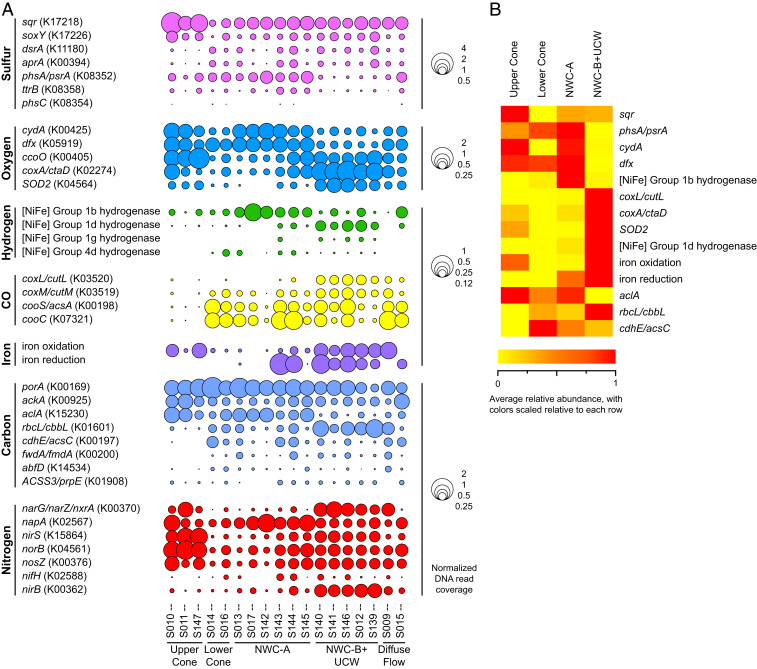
Fig. 3.
Relative normalized abundance of metabolic and functional genes involved in energy generation, oxygen tolerance, and biogeochemical cycling from Brothers volcano metagenome assemblies, including those discussed in the text. (A) Bubbles represent single genes or iron metabolism gene categories listed in Dataset S2B. Bubble size indicates normalized abundance, calculated by dividing the summed coverage for each gene/gene category in an assembly by the average summed coverage for 14 single-copy marker genes. Full gene names are shown in Dataset S2B. (B) Heat map shows the average normalized abundance of genes/gene categories discussed in the text. Normalized abundance was determined as described above and subsequently averaged across all assemblies at each particular area (UC, n = 3 assemblies; LC, n = 2 assemblies; NWC-A, n = 6 assemblies; NWC-B+UCW, n = 5 assemblies). Coloring is scaled relative to each row, with red indicating the highest average relative abundance of the four areas and yellow indicating the lowest average relative abundance. Normalized abundance of genes and gene categories and full gene names are shown in Dataset S2B.

