Fig. 1.
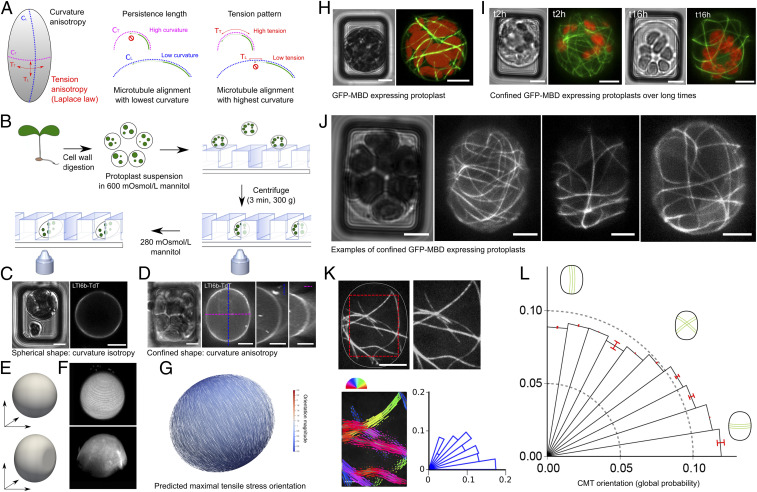
Cortical microtubule response to protoplast confinement. (A) Main hypothesis: In a confined protoplast, transverse curvature is higher than longitudinal curvature, resulting in a competition between steric and mechanical cues; lower curvature would accommodate microtubule high bending stiffness, while high curvature would prescribe high tension to which microtubules may align with. (B) Schematic summary of the protocol used to confine and image protoplasts in microwells. (C) pUbQ1O::LTI6b-TdTomato (membrane marker) protoplast. Transmitted light channel (Left) and TdTomato fluorescence channel (Right). (D) pUBQ10::LTI6b-tdTomato images of a deformed and turgid (280 mOsmol/L mannitol) protoplast. Transmitted light channel (Left) and fluorescence of TdTomato channel (Right). Orthogonal views are presented at Right. (E) FEM representation of an unconfined protoplast (sphere, Upper) and confined protoplast (Lower). (F) Three-dimensional reconstruction from confocal stacks for an unconfined (Upper) and confined (Lower) protoplast expressing pUBQ10::LTI6b-tdTomato (280 mOsmol/L mannitol). (G) FEM simulation for a confined ellipsoid with an aspect-ratio (length/width) of 1.15, as measured in our experiments (1.13–1.17). Maximal tensile stress is predicted to be transverse, following Laplace–Young law. (H) p35S::GFP-MBD protoplast. (Left) Transmitted light channel. (Right) GFP fluorescence channel. Red, autofluorescence of chloroplasts; green, microtubule signal. (I, Left) Transmitted light channel and GFP fluorescence channel, 2 h after protoplast’s insertion in the microwell. (I, Right) Transmitted light channel and GFP fluorescence channel, 16 h after protoplast’s insertion in the microwell. Two different protoplasts are shown. (J) Examples of p35S::GFP-MBD protoplast images, illustrating the diversity of microtubule orientations in 15 × 20 µm microwells in pressurized (280 mOsmol/L mannitol) and confined protoplasts. Protoplasts were imaged 2 h after their transfer into hypotonic solution. (K) Analysis of CMT orientation with SFT. The cropped zone is delineated with the dotted red lines. The orientation of CMTs in each ROI is color coded. Polar histograms represent the CMT angle distribution for the protoplast. Each bar corresponds to an angle range of 9°. (L) Polar histograms of the probability of CMT orientations (classes of 9° angles) in all protoplasts, confined in 15 × 20 µm microwells, imaged 2 h after their transfer in 280 mOsmol/L mannitol (n = 126 protoplasts, three independent replicates). (Scale bars, 5 µm.)

