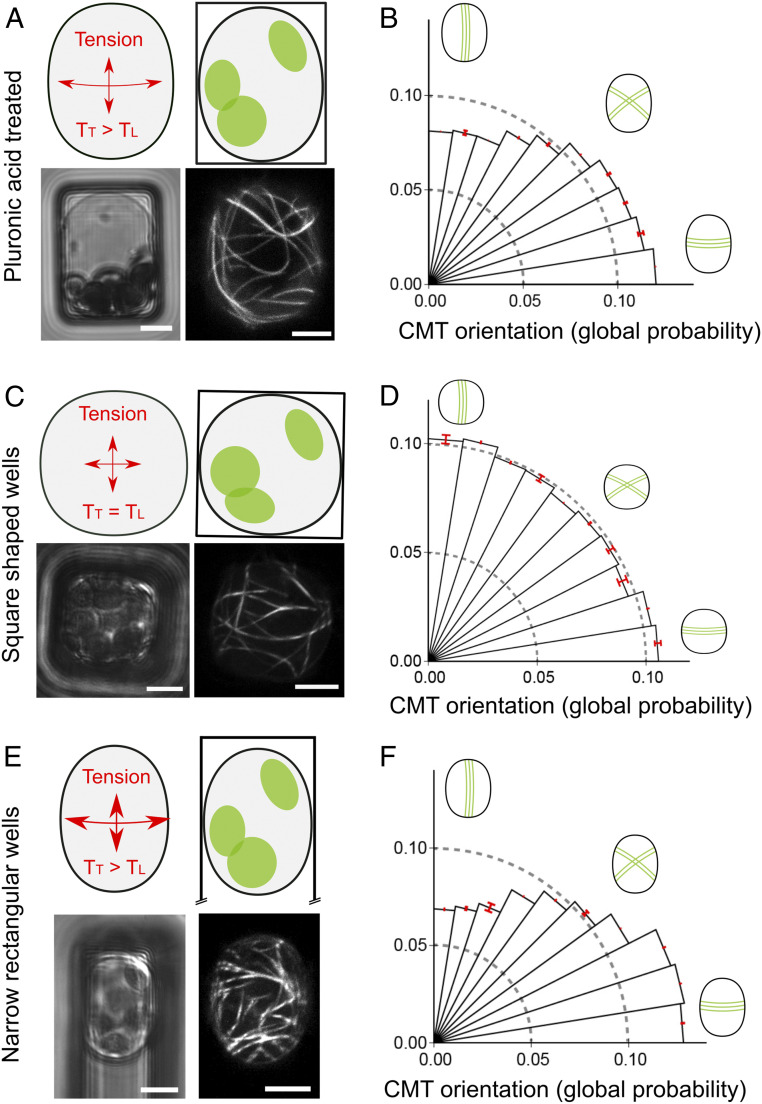
Fig. 2.
Challenging the transverse orientation of CMTs in confined and pressurized protoplasts. (A) Schematic representation of the stress pattern in 15 × 20 µm microwell. p35S::GFP-MBD pressurized protoplast, confined in 15 × 20 µm microwell, was pretreated with pluronic acid to reduce protoplasts adhesion to the well sides, and in 280 mOsmol/L mannitol. (Lower Left)Transmitted light channel. (Lower Right) GFP fluorescence channel. (B) Polar histograms representing the probability of CMT orientations (classes of 9° angles) in protoplasts confined in 15 × 20 µm passivated microwells and imaged 2 h after their transfer to 280 mOsmol/L mannitol (n = 29 protoplasts). (C) Schematic representation of protoplast curvature in 14 × 14 µm square-shaped wells. p35S::GFP-MBD protoplast was confined in 14 × 14 µm microwell in 280 mOsmol/L mannitol. (Lower Left)Transmitted light channel. (Lower Right) GFP fluorescence channel. (D) Polar histograms representing the probability of CMT orientations (classes of 9° angles) in protoplasts confined in 14 × 14 µm microwells and imaged 2 h after their transfer to 280 mOsmol/L mannitol (n = 74 protoplasts, three independent replicates). (E) Schematic representation of protoplast curvature in 12 × 40 µm wells. p35S::GFP-MBD protoplast was confined in 12 × 40 µm microwell in 280 mOsmol/L mannitol. (Lower Left) Transmitted light channel. (Lower Right) GFP fluorescence channel. (F) Polar histograms representing the probability of CMT orientations (classes of 9° angles) in protoplasts confined in 12 × 40 µm microwells, imaged 2 h after their transfer to 280 mOsmol/L mannitol (n = 99 protoplasts, four independent replicates). (Scale bars, 5 µm.)

