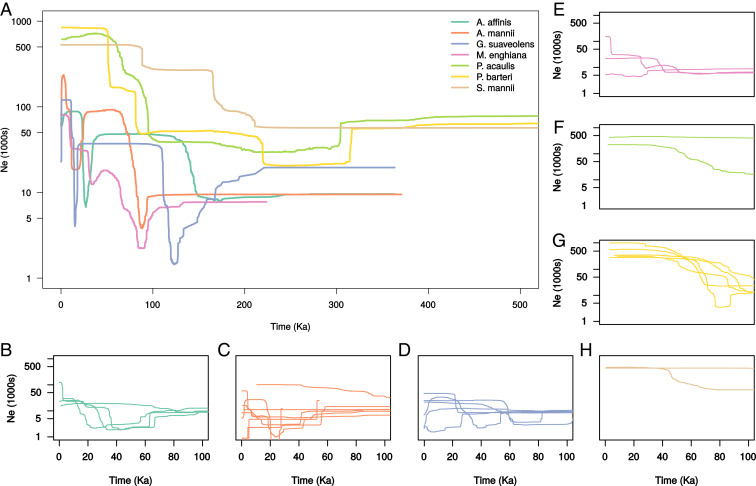
Fig. 4.
Demographic histories of seven Lower Guinean rain forest species. Population size changes were reconstructed by using the Stairway Plot method. Median effective population sizes () over time are shown by colored lines. A shows patterns inferred using all individuals in each species. B–H show demographic trends for each genetic cluster detected within each species, based on the same color code as A. Additional plots, including CIs, can be found in ref. 92.

