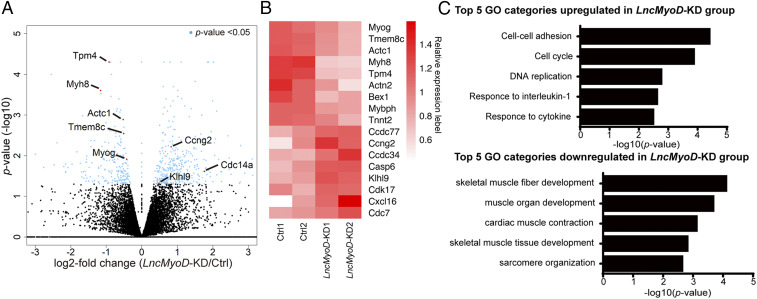
Fig. 4.
Loss of LncMyoD leads to deficiencies in myogenic lineage progression. (A) Volcano plot showing gene expression-level changes between the Ctrl and LncMyoD KD groups. Blue dots represent genes with P values <0.05. (B) Heat map plot showing relative expression level of representative genes between the Ctrl and LncMyoD KD samples. (C) Gene ontology (GO) analysis of differentially expressed genes in the LncMyoD KD group.

