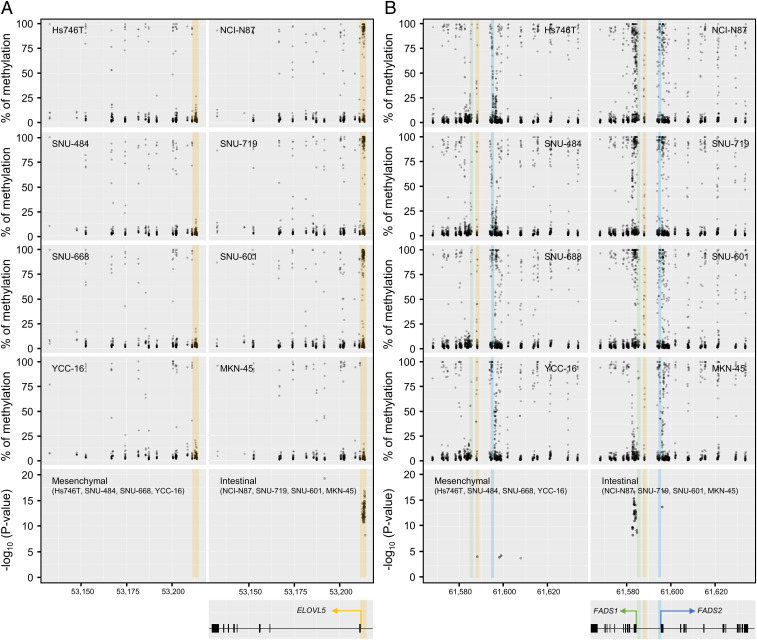
Fig. 6.
ELOVL5 and FADS1 expression is down-regulated through DNA hypermethylation. (A and B) Manhattan plot of the methylation levels and statistical significance of methylation at each CpG site in the promoter regions of ELOVL5 (A) and FADS1/2 (B) in mesenchymal-type (Hs746T, SNU484, SNU-668, and YCC-16) and intestinal-type (NCI-N87, SNU-719, SNU-601, and MKN-45) GCs. The putative enhancer/promoter region of ELOVL5 (chr6: 53,211,316 to 53,214,820) is highlighted in orange. The putative regions of the FADS1 promoter (chr11: 61,584,650 to 61,586,300), FADS2 promoter (chr11: 61,594,300 to 61,595,600) and putative enhancer (chr11: 61,587,300 to 61,589,000) are colored in green, blue, and orange, respectively (36).

