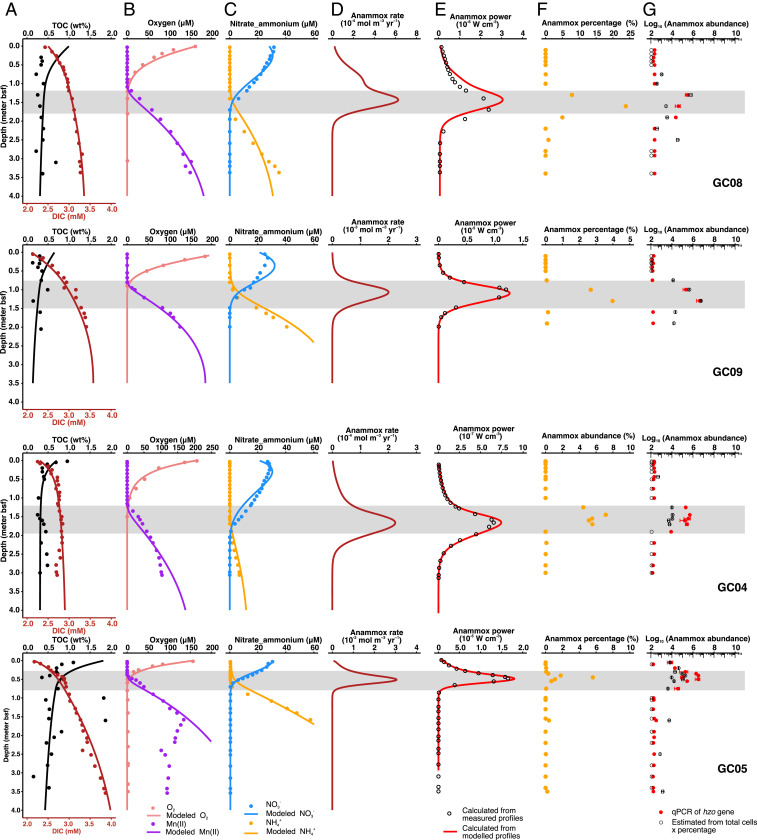
Fig. 2.
Environmental context, reaction rate, power supply, and distribution of anammox bacteria in AMOR sediment cores. (A–C) Measured (dots) and modeled (lines) depth profiles of TOC, DIC, oxygen, dissolved manganese, nitrate, and ammonium. (D) Anammox rate calculated based on model simulation. Note different x-axis scales used between cores. (E) Power supply of anammox calculated as the products of anammox rate and Gibbs free energy per anammox reaction (calculated from measured [dots] and modeled [lines] concentrations of relevant chemical species) presented in SI Appendix, Fig. S3. Note different x-axis scales used between cores. (F) Percentage of anammox bacteria from the genus of Scalindua in the amplicon libraries. (G) Anammox bacteria abundance quantified by two methods: 1) qPCR targeting the hzo gene (encodes the hydrazine dehydrogenase) (filled red dots), and 2) estimated as the product of anammox bacteria percentage in F and the total cell abundances quantified by 16S rRNA gene copies (open dots). Gene abundances below detection limit were arbitrarily shown as 100 copies g−1. Error bars represent the SD of triplicate qPCR measurements. The NATZ in each core is highlighted by a gray band.

