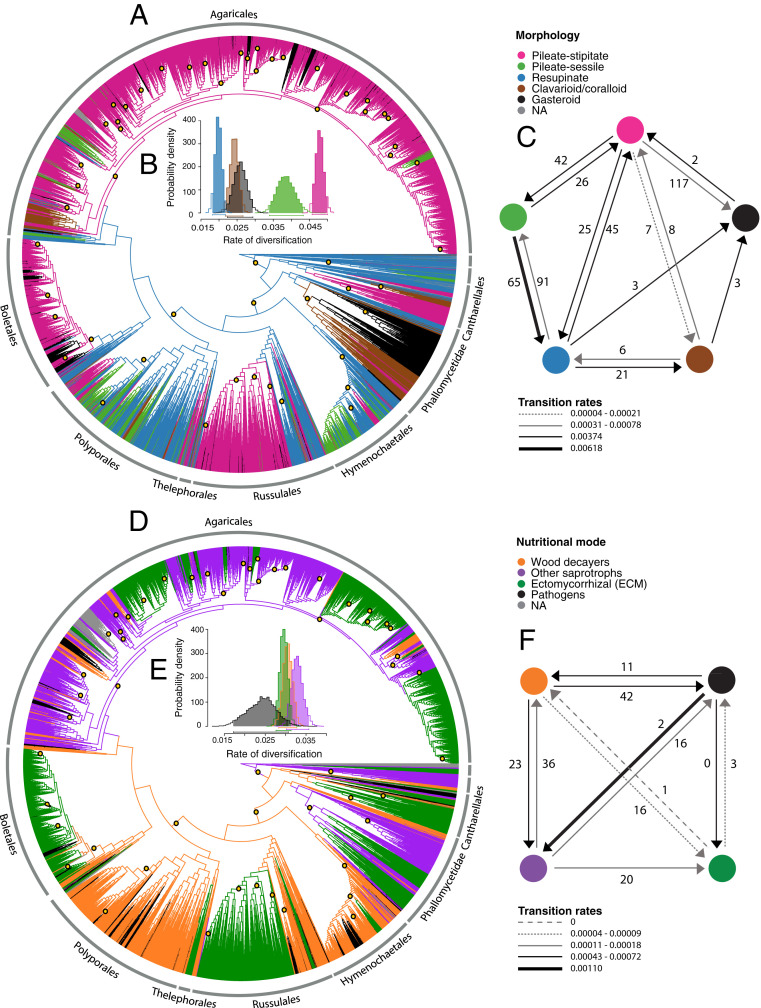
Fig. 2.
(A–C) Macroevolutionary dynamics of fruiting body forms in Agaricomycetes. (D–F) Macroevolutionary dynamics of nutritional modes in Agaricomyctes. (A and D) Stochastic mapping of five fruiting body forms and four nutritional modes, respectively. The yellow dots indicate shifts in diversification rates according to BAMM. Only major orders of Agaricomycetes are labeled. (B and E) The posterior probability distributions of net diversification rates (speciation minus extinction) from the MuSSE model. The bar underneath each distribution represents the 95% credible interval obtained from the posterior distribution. (C and F) The number of average transitions between character states estimated from a set of 100 stochastic maps by SIMMAP and transition rates estimated by MuSSE (NA = not applicable). The absence of arrows between states indicates zero transitions as well as transition rates.

