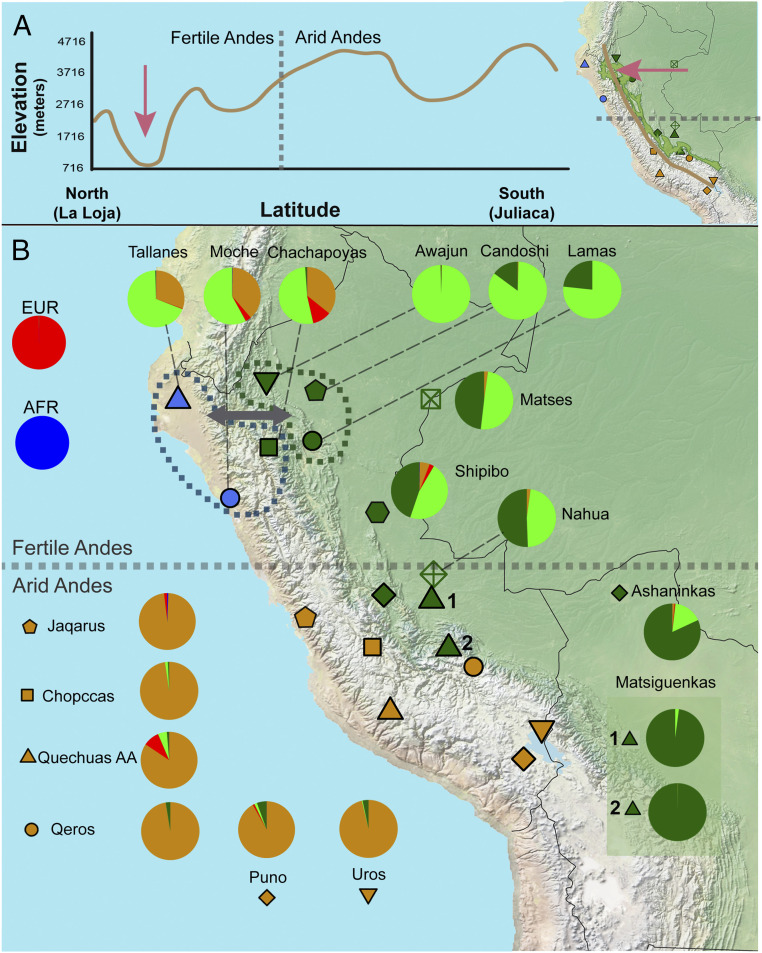
Fig. 1.
Genetic and geographic landscape for western South American natives. (A) Elevation vs. latitude plot from a cross-section line in the Andean region from La Loja (Ecuador) to Juliaca (Peru). A vertical line indicates the division between Fertile and Arid Andes (16). The map shows the path used to create the plot elevation and latitude plot and a green area delimiting the area of the Amazon Yunga region. Altitude data were obtained from Google Maps (https://www.google.com.br/maps). (B) Geographic distribution and genetic structure for 18 native populations from the coast, Andes, and Amazon inferred by ADMIXTURE result (K = 5, corresponding to the lowest cross-validation error). Pie charts show the average percentages over individuals for the five ADMIXTURE clusters in each population. Three clusters were related to Native American groups: one Andean (brown) and two Amazonian (green clusters). Two clusters were associated with non-Native continental ancestries (European [red] and African [dark blue]). Blue and green dashed lines delimit the groups that showed a highly significant D statistic value, indicating gene flow (gray arrow, |Z score| > 4, SI Appendix, Figs. S14–S17). Matsiguenkas 1= Matsiguenkas-Sepahua, Matsiguenkas 2= Matsiguenkas-Shimaa. The gray horizontal dashed line in the center of the map shows the approximate division between the fertile Andes and arid Andes (16).

