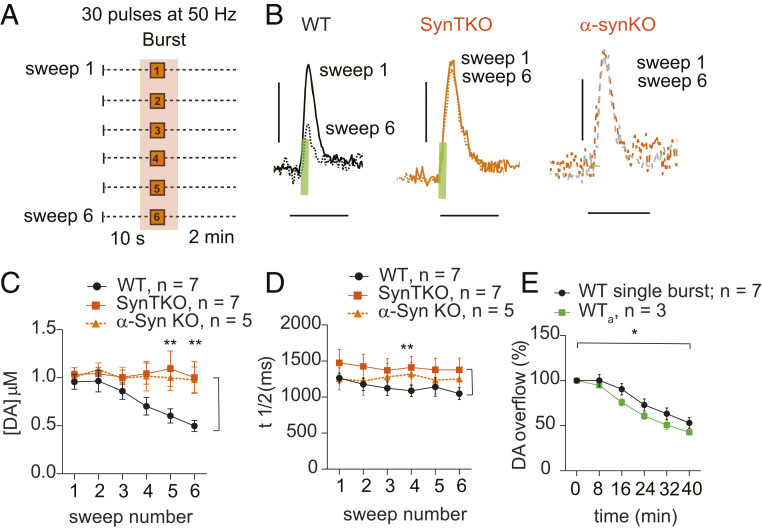
Fig. 3.
Synuclein-dependent decrease in evoked DA release during stimulation of midbrain neurons with single bursts and long (6-min) rest intervals. (A) Schematic of the stimulus paradigm. Shaded area highlights parts of the sweeps used for the analysis. (B) Evoked DA signal peaks following single burst stimulus (30 pulses at 50 Hz) from sweeps 1 and 6 showing the differences in DA release between WT (black; sweep 1, solid line; sweep 6, dotted line), synuclein triple knockout (SynTKO; orange; sweep 1, solid line; sweep 6, dotted line), and α−synuclein (α-SynKO sweep 1, orange dotted line; sweep 6, grey dotted line) mice. Green bars indicate electrical stimulation duration (0.6 s). (Scale bars: y axis, 500 nM DA; x axis, 5 s.) (C) Dopamine release decreases across sweeps in WT (black; one-way ANOVA within genotype: F5,36 = 5.2, P = 0.001; Tukey’s multiple comparison: sweep 1 vs. sweep 6, P = 0.006) but not in SynTKO (orange; one-way ANOVA within genotype: F5,36 = 0.073, P = 0.99, not significant by Tukey’s post hoc) and α-SynKO (orange-broken line; one-way ANOVA within genotype: F5,24 = 0.11, P = 0.99, not significant by Tukey’s post hoc) mice, resulting in significant difference between genotypes (two-way ANOVA between genotypes: F2,96 = 12.4, P < 0.0001; Tukey’s multiple comparison test showed significance between WT and SynTKO in bursts 5 and 6 (P = 0.003, 0.002 respectively), as well as WT and α-SynKO in bursts 5 and 6 (0.04, 0.009 respectively) (WT, n =7, SynTKO, n = 7, α-SynKO, n = 5). (D) The t1/2 did not change across sweeps in any of the genotypes. There was a shorter t1/2 in WT than in SynTKO, but not α-SynKO (two-way ANOVA: WT vs. SynTKO: F1,72 = 11.6, P = 0.001; WT vs. α-SynKO: F1,60 = 2.3, P = 0.12; WT, n = 7; SynTKO, n = 7; α-SynKO, n = 5). (E) Dopamine release decreased similarly in WT mice stimulated either with single burst within a sweep (black, same data as C) or single bursts only at 2-min intervals (green; one-way ANOVA within genotype: F5,12 = 37, P < 0.0001; Tukey’s multiple comparison: sweep 1 vs. sweep 6, P < 0.0001) (two-way ANOVA between genotypes: F1,48 = 5.8, P = 0.02. Bonferroni’s multiple comparison test did not show significance, n: WT, n = 7, WTa, n = 3). * = P < 0.05, ** = P < 0.005.

