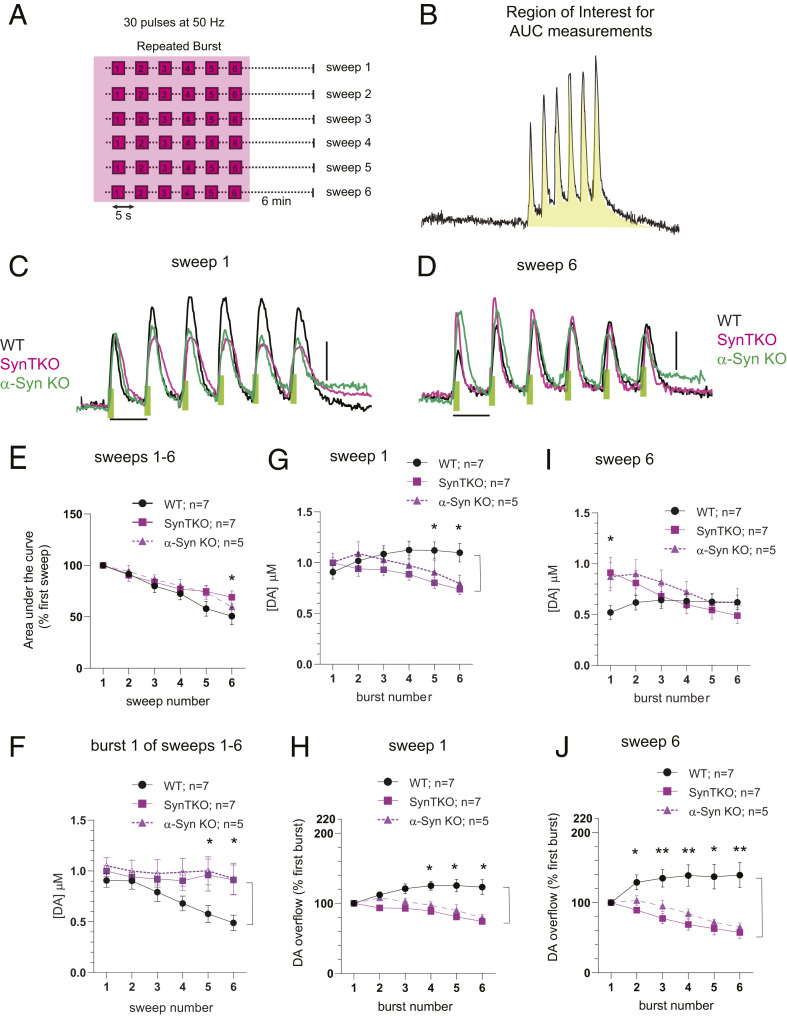
Fig. 4.
Synuclein-dependent facilitation of DA release during short-interval (5-s) burst stimuli. (A and B) Regions of the stimulation paradigm used for data analysis (shaded area). (C and D) Representative recordings of evoked DA release resulting from repeated burst stimulations during sweep 1 (C) and sweep 6 (D). WT (black) mice demonstrate short-term intraburst potentiation, while SynTKO (magenta) and α-SynKO (green) mice show short-term depression in vivo. Green bars indicate the duration (0.6 s) of electrical stimulation (Scale bar: y axis, 500 nM DA; x axis, 5 s.) (E) Depression of overall DA release during the entire train of repeated bursts duration measured as total AUC (as shown on B) across sweeps 1 to 6. Similar to single-burst data (Fig. 3C), depression of DA release was observed in WT mice (one-way ANOVA within genotype: F5,36 = 12.7, P < 0.0001; Tukey’s multiple comparison: sweep1 vs. sweep 6, P < 0.0001; n = 7) but not in SynTKO (one-way ANOVA within genotype: F5,42 = 0.8, P = 0.6; Tukey’s multiple comparison: not significant; n = 7) or α-SynKO (one-way ANOVA within genotype: F5,24 = 0.8, P = 0.6: Tukey multiple comparison: not significant; n = 5) animals. Two-way ANOVA between genotypes: F2,96 = 3.4, P = 0.04. Tukey’s multiple comparison: P = 0.04 between sweep 6 in WT and SynTKO. (F) Dopamine release in the first burst of repeated burst protocol decreases across sweeps in WT (one-way ANOVA within genotype: F5,30 = 21.9, P < 0.0001; n = 7) but not in SynTKO (one-way ANOVA within genotype: F5,30 = 0.29, P = 0.9; n = 7) and α-SynKO (one-way ANOVA within genotype: F5,30 = 0.41, P = 0.8 ; n = 5) mice. Two-way ANOVA between genotypes: F2,96 = 11.6, P < 0.0001; Tukey’s multiple comparison test: significance between WT and SynTKO in burst numbers 5 and 6 (P = 0.02, 0.007 respectively) and WT and α-SynKO between burst numbers 5 and 6 (P = 0.02, 0.01 respectively). (G) Facilitation of DA release during sweep 1 in WT (one-way ANOVA within genotype: F5,30 = 4.8, P = 0.0024; n = 7) and depression of DA release in SynTKO (one-way ANOVA within genotype: F5,30 = 13.0, P < 0.0001; n = 7) and α-SynKO (one-way ANOVA within genotype: F5,20 = 9.5, P < 0.0001 ; n = 5) animals during repeated trains of burst. Two-way ANOVA between genotypes: F2,96 = 7.9, P = 0.0006; Tukey’s multiple comparison test showed significance between WT and SynTKO in burst numbers 5 and 6 (P = 0.01, 0.004 respectively) and WT and α-SynKO between burst number 6 (P = 0.03). (H) Same data as G normalized to the first peak of each sweep. Two-way ANOVA between genotypes: F2,96 = 49.8, P < 0.0001; Tukey’s multiple comparison test showed significance between WT and SynTKO in burst numbers 2 to 6 (P = 0.04, 0.0008, <0.0001, <0.0001, <0.0001, respectively) and WT and α-SynKO between burst numbers 4 to 6 (P = 0.003, 0.0001, <0.0001, respectively). (I) Facilitation of DA release during sweep 6 in WT (one-way ANOVA within genotype: F5,30 = 2.9, P = 0.028) and depression of DA release in SynTKO (one-way ANOVA within genotype: F5,30 = 8.2, P < 0.0001; n = 7) and α-SynKO (one-way ANOVA within genotype: F5,20 = 6.1, P = 0.0013 ; n = 5) animals during repeated trains of burst. Two-way ANOVA between genotypes: F2,96 = 3.6, P = 0.03; Tukey’s multiple comparison test showed significance between WT and SynTKO in burst 1 (P = 0.006) and WT and α-SynKO between burst 1 (P = 0.03). (J) Same data as I normalized to the first peak of each sweep. Two-way ANOVA between genotypes: F2,96 = 49.8, P < 0.0001; Tukey’s multiple comparison test showed significance between WT and SynTKO in burst numbers 3 to 6 (P = 0.01, 0.0002, <0.0001, <0.0001, <0.0001, respectively) and WT and α-SynKO between burst numbers 4 to 6 (P = 0.03, 0.002, 0.0001, <0.0001, respectively). Data points represent mean ± SEM. * = P < 0.05, ** = P < 0.005.

