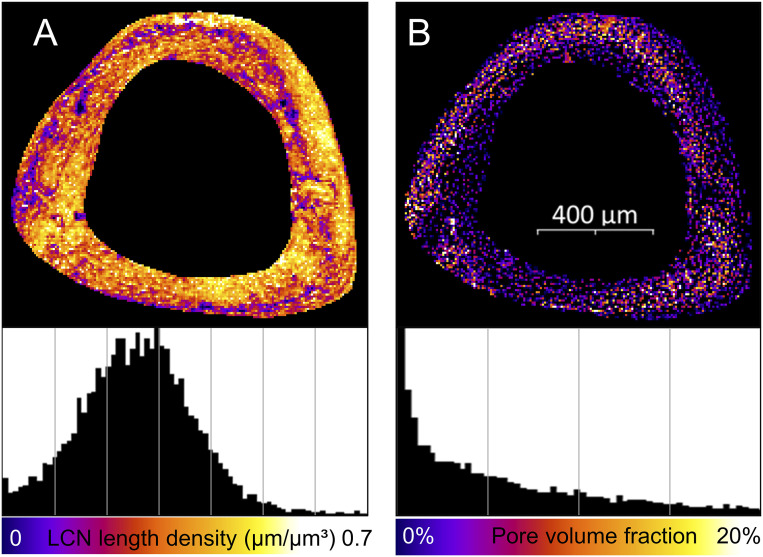
Fig. 2.
Structural heterogeneity of the lacunocanalicular network (LCN) within the tibial cross-section averaged over the imaging depth of 50 µm. (A) Map of the canalicular density (Ca.Dn, total length of canaliculi per unit volume). (B) Map of the pore density (i.e., volume of both lacunae and vascular canals per unit volume). Below, frequency distributions are shown for both quantities with x-axis ticks as lines.

