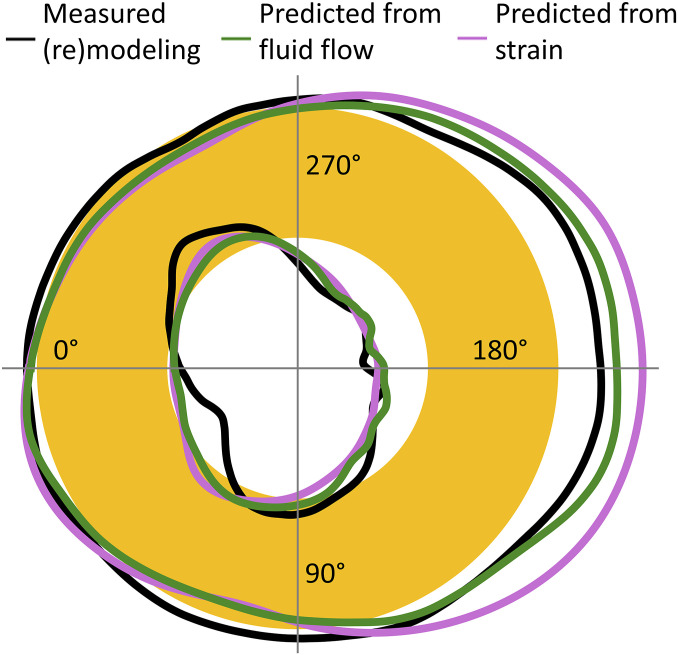
Fig. 4.
Result of in vivo µCT measurements in terms of bone formation and resorption after 2 wk of controlled loading of the tibia. The tibial cross-section is represented schematically as a circular annulus (yellow). The black line denotes the amount of resorbed bone (line entering yellow cortex) and formed bone (depiction not to scale). The pink line denotes the prediction of the mechanoresponse based on strain only; the green line is the prediction based on load-induced fluid flow, which considers not only the loading condition but also the architecture of the lacunocanalicular network (LCN). Strain rate and fluid flow velocity were integrated over regions close to the surface (Materials and Methods) to obtain a single value.

