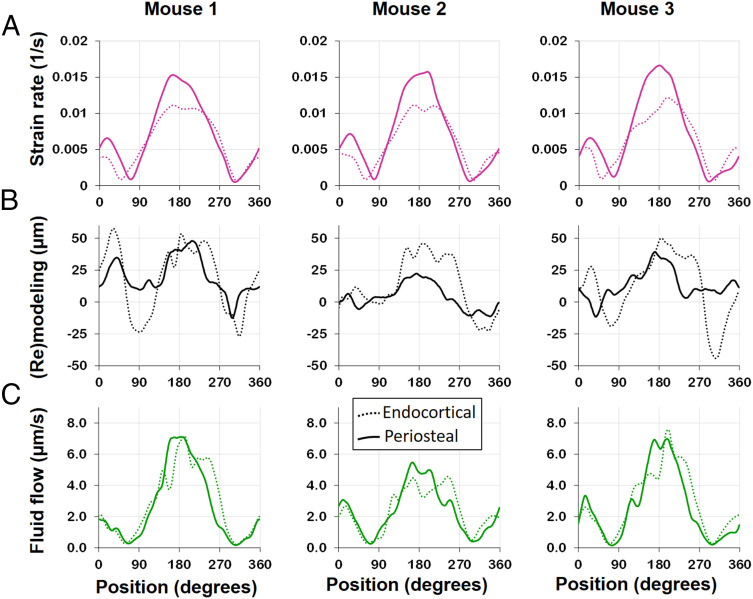
Fig. 5.
Evaluation of absolute surface strain rate (A), (re)modeling thickness (B), defined as new bone thickness minus resorption cavity depth, and surface fluid flow velocity (C) for all three investigated mice (see Fig. 3B for definition of angles). Strain rate and fluid flow velocity were integrated over regions close to the surface (Materials and Methods) to obtain a single value. (A) Strain rates at the endocortical surface (dotted line) are lower compared to the periosteal surface (solid line), and the spatial distribution and peak values are very similar between mice. (B) The mechanoresponse shows individual differences in bone (re)modeling, with mouse 2 showing less (re)modeling compared to the two other mice. (C) Also surface fluid velocity was found to be lower in mouse 2, while for all animals the flow velocities show similar distributions on the endocortical and periosteal surfaces.

