Fig. 3.
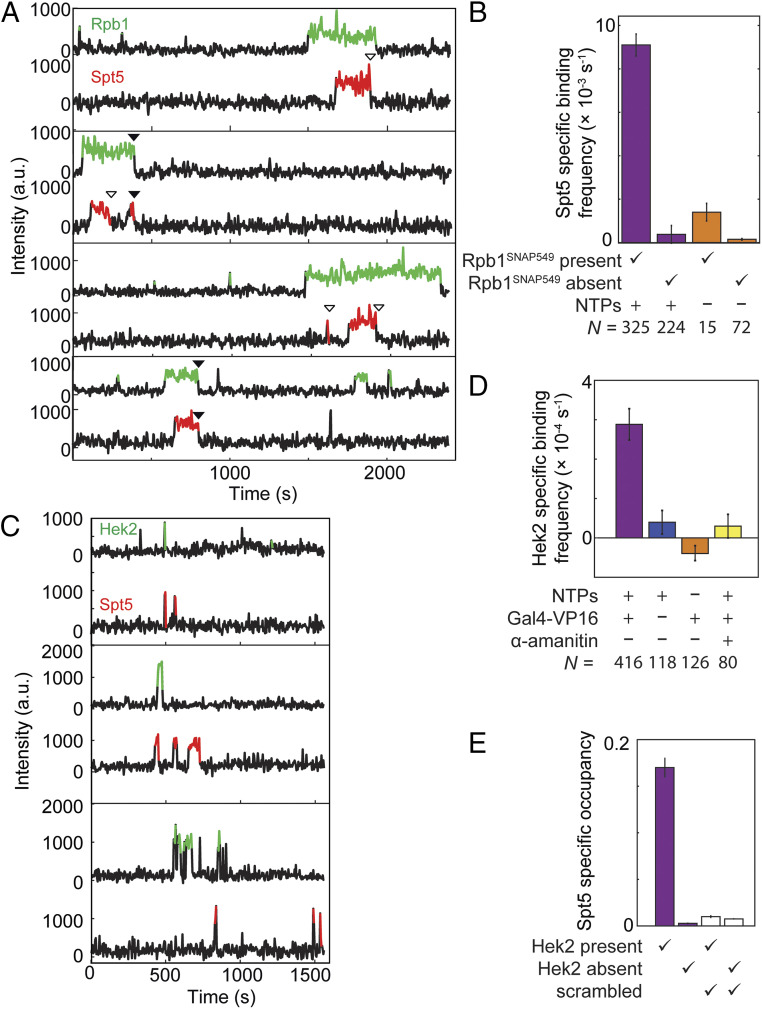
Correlation of Spt4/5 binding at individual DNA molecules with binding of RNApII (A and B) or Hek2 (C–E). (A) Example time records of Rpb1SNAP549 and Spt5DHFR-Cy5 fluorescence at four individual DNA488 locations, taken from the Rpb1SNAP549/Spt5DHFR-Cy5 experiment shown in Fig. 1. Colored intervals indicate times at which a fluorescent Rpb1SNAP549 (green) and/or Spt5DHFR-Cy5 (red) spot colocalized to the DNA488 molecule being monitored. Each Spt5DHFR-Cy5 departure is marked according to whether it occurred before (open triangles) or simultaneously with (closed triangles) Rpb1SNAP549 departure. Additional example records are shown in SI Appendix, Fig. S3. (B) DNA-specific binding frequencies (± SE) of Spt5DHFR-Cy5, calculated separately for time intervals when Rpb1SNAP549 was present or absent at the DNA. DNA-specific binding frequency is calculated as the frequency seen at DNA locations that is in excess of the background nonspecific binding seen at no-DNA locations. (C) Examples of time records of Hek2SNAP549 and Spt5DHFR-Cy5 fluorescence over time at three individual DNA488 locations taken from an experiment using a dual-tagged Hek2SNAP549/Spt5DHFR-Cy5 yeast nuclear extract in the presence of NTPs and Gal4-VP16. (D) DNA-specific binding frequencies (± SE) of Hek2SNAP549 under transcription conditions (purple) and in negative controls (blue, orange, and yellow); see SI Appendix, Table S3. (E) Mean fraction (± SEM) of time that a DNA488 molecule had a colocalized Spt5DHFR-Cy5, after correction for nonspecific surface binding. Separate analyses were conducted for time points at which Hek2SNAP549 was present or absent (SI Appendix, Table S4). Data may underestimate the true occupancy of DNA locations by Spt4/5 due to possible incomplete labeling of Spt5DHFR-Cy5, but this factor is constant across all four bars. Open bars show results of a scrambled negative control analysis of the same data (SI Appendix, Materials and Methods) showing that the correlation of Spt5 binding with Hek2 binding is not a statistical artifact. Data in D (purple bar) and E are aggregated from the experiment in C and one additional replicate.

