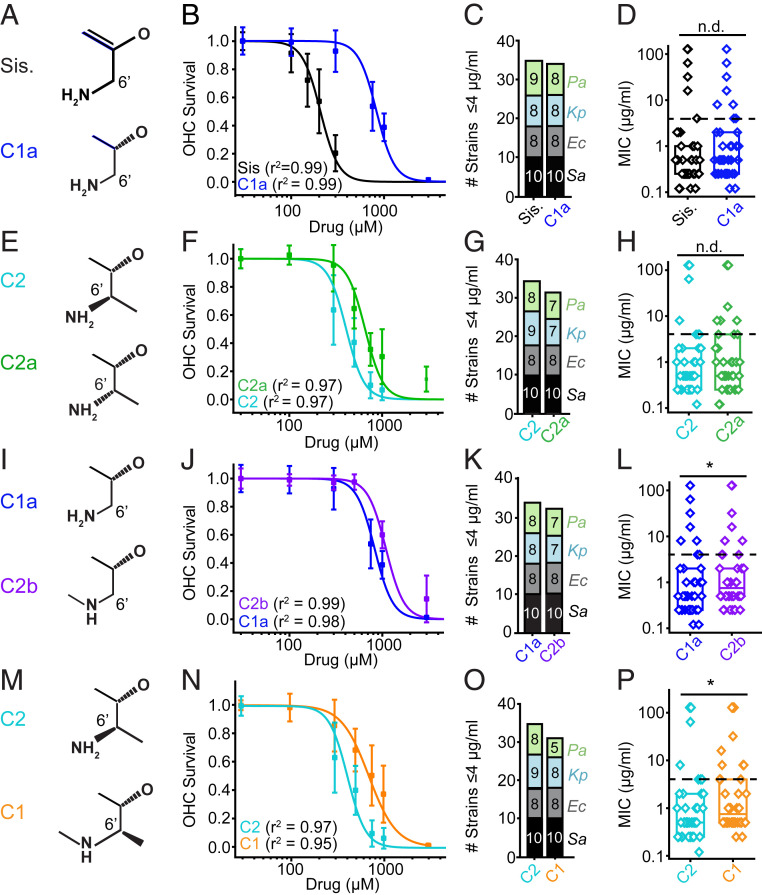
Fig. 3.
Structure–activity relationships between gentamicin subtypes: Ototoxicity and antimicrobial activity. (A) Sisomicin and C1a differ at the 4′ and 5′ position. (B) C4′-5′ saturation alters ototoxicity. Sisomicin has a lower EC50 than C1a (P < 0.05, F-test, n = 8 to 60; Sis. = 199 ± 17 μM, C1a = 821 ± 24 μM). (C). Sisomicin and C1a have similar antimicrobial breadths (35 vs. 34 stains). (D) There is no difference in potency between sisomicin and C1a (P > 0.05, Mann–Whitney U test, all strains). (E) Gentamicin C2 and C2a are epimers at the C6′ position. (F) C2 is more ototoxic than C2a (P < 0.05, F-test, n = 7 to 16; C2 = 403 ± 23 μM, C2a = 656 ± 36 μM). (G) C2 and C2a have similar antimicrobial breadths (35 vs. 32 strains). (H) C2 and C2a show no difference in antimicrobial potency (P > 0.05, Mann–Whitney U test, all strains). (I) Gentamicin C1a and C2b differ at the N6′ site. (J) C1a has a lower EC50 than C2b (P < 0.05, F-test, n = 8; C2b = 1,130 ± 22 μM, C1a = 821 ± 24 μM). (K) C1a and C2b have similar antimicrobial breadths (34 vs. 32 strains). (L) There is a detectable difference in potency between C1a and C2b (P < 0.05, Mann–Whitney U test, all strains). Fig. 2 shows this is related to P. aeruginosa strains. (M) Gentamicin C2 and C1 differ at the N6′ position. (N) C2 has a lower EC50 than C1 (P < 0.05, F-test, n = 8; C2 = 403 ± 23 μM, C1 = 728 ± 59 μM). (O) C2 has a slightly higher breadth than C1 (four strains). (P) C2 is more potent than C1 (P < 0.05, Mann–Whitney U test, all strains). Fig. 1 shows breakdown by species for all compounds. *P < 0.05, n.d., no difference.

